

Question: Use either a newspaper or the Internet to select one company traded on the NYSE. Record the daily closing stock price and the daily changes
Use either a newspaper or the Internet to select one company traded on the NYSE. Record the daily closing stock price and the daily changes of your company for the six past consecutive weeks (so that you have 30 values for each). Decide whether your 2 data sets are normally distributed by creating a histogram or a boxplot.
I have already found the company which is Delta Airlines, I also did some of the work now I just want to find the difference for the numbers below
13-Apr-22 41.02
12-Apr-22 38.62
11-Apr-22 38.21
8-Apr-22 36.74
7-Apr-22 37.13
6-Apr-22 37.59
5-Apr-22 39.03
4-Apr-22 39.4
1-Apr-22 39.31
31-Mar-22 39.57
30-Mar-22 39.33
29-Mar-22 39.52
28-Mar-22 38.34
25-Mar-22 37.91
24-Mar-22 37.26
23-Mar-22 36.22
22-Mar-22 36.98
21-Mar-22 36.09
18-Mar-22 37.68
17-Mar-22 37.15
16-Mar-22 36.93
15-Mar-22 34.86
14-Mar-22 32.07
11-Mar-22 32.07
10-Mar-22 32.55
9-Mar-22 32.76
8-Mar-22 31.22
7-Mar-22 30.11
4-Mar-22 34.52
3-Mar-22 36.56
Mean 36.5583333
Standard Error 0.51555418
Median 37.14
Mode 32.07
Standard Deviation 2.82380653
Sample Variance 7.97388333
Minimum 30.11
Maximum 41.02
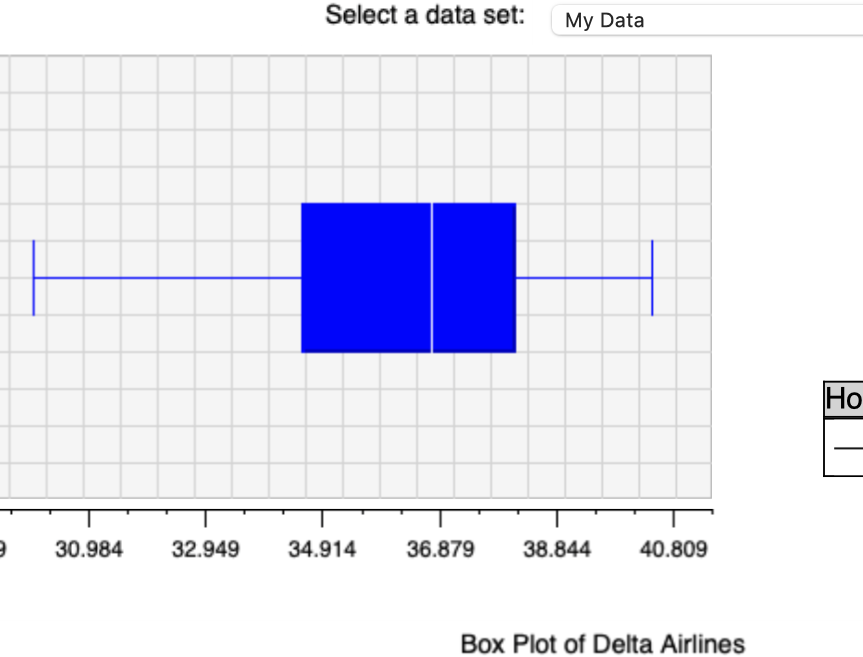
Select a data set: My Data Ho 30.984 32.949 34.914 36.879 38.844 40.809 Box Plot of Delta Airlines
Step by Step Solution
There are 3 Steps involved in it

Get step-by-step solutions from verified subject matter experts