

Question: use excel 1. You have just signed up for a retirement plan and can invest your money in an equity fund (E) or a bond
use excel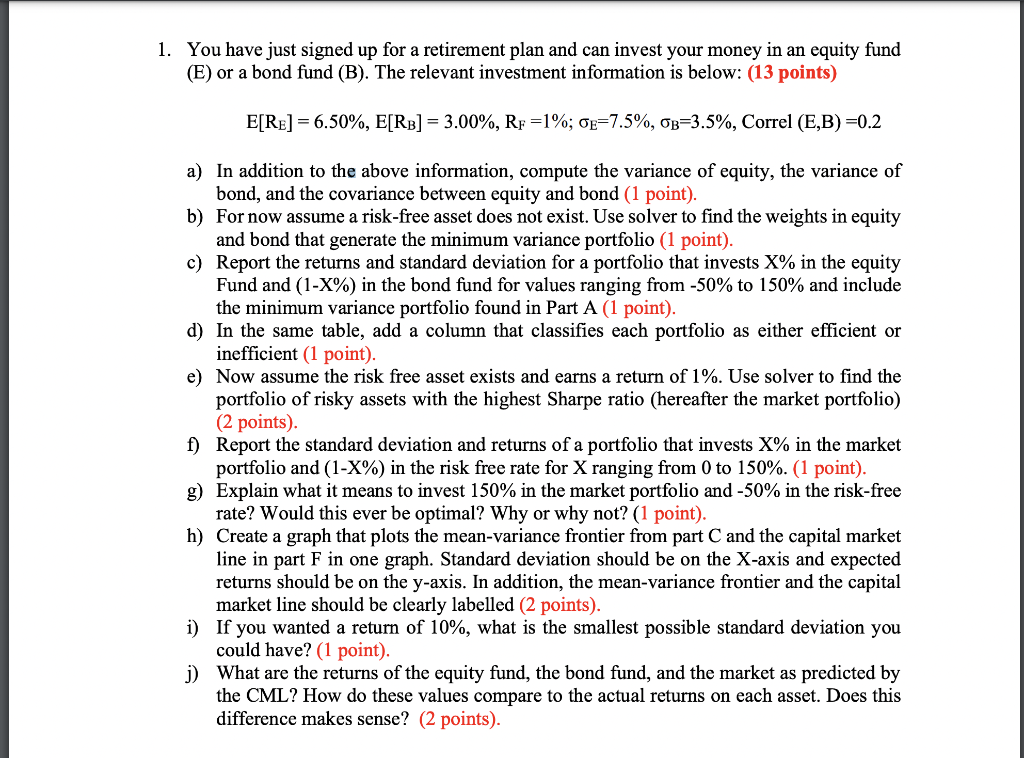
1. You have just signed up for a retirement plan and can invest your money in an equity fund (E) or a bond fund (B). The relevant investment information is below: (13 points) E[RE] =6.50%, E[RB] = 3.00%, RF =1%; 0E=7.5%, OB=3.5%, Correl (E,B) =0.2 a) In addition to the above information, compute the variance of equity, the variance of bond, and the covariance between equity and bond (1 point). b) For now assume a risk-free asset does not exist. Use solver to find the weights in equity and bond that generate the minimum variance portfolio (1 point). c) Report the returns and standard deviation for a portfolio that invests X% in the equity Fund and (1-X%) in the bond fund for values ranging from -50% to 150% and include the minimum variance portfolio found in Part A (1 point). d) In the same table, add a column that classifies each portfolio as either efficient or inefficient (1 point). e) Now assume the risk free asset exists and earns a return of 1%. Use solver to find the portfolio of risky assets with the highest Sharpe ratio (hereafter the market portfolio) (2 points) f) Report the standard deviation and returns of a portfolio that invests X% in the market portfolio and (1-X%) in the risk free rate for X ranging from 0 to 150%. (1 point). g) Explain what it means to invest 150% in the market portfolio and -50% in the risk-free rate? Would this ever be optimal? Why or why not? (1 point). h) Create a graph that plots the mean-variance frontier from part C and the capital market line in part F in one graph. Standard deviation should be on the X-axis and expected returns should be on the y-axis. In addition, the mean-variance frontier and the capital market line should be clearly labelled (2 points). i) If you wanted a return of 10%, what is the smallest possible standard deviation you could have? (1 point). j) What are the returns of the equity fund, the bond fund, and the market as predicted by the CML? How do these values compare to the actual returns on each asset. Does this difference makes sense? (2 points). 1. You have just signed up for a retirement plan and can invest your money in an equity fund (E) or a bond fund (B). The relevant investment information is below: (13 points) E[RE] =6.50%, E[RB] = 3.00%, RF =1%; 0E=7.5%, OB=3.5%, Correl (E,B) =0.2 a) In addition to the above information, compute the variance of equity, the variance of bond, and the covariance between equity and bond (1 point). b) For now assume a risk-free asset does not exist. Use solver to find the weights in equity and bond that generate the minimum variance portfolio (1 point). c) Report the returns and standard deviation for a portfolio that invests X% in the equity Fund and (1-X%) in the bond fund for values ranging from -50% to 150% and include the minimum variance portfolio found in Part A (1 point). d) In the same table, add a column that classifies each portfolio as either efficient or inefficient (1 point). e) Now assume the risk free asset exists and earns a return of 1%. Use solver to find the portfolio of risky assets with the highest Sharpe ratio (hereafter the market portfolio) (2 points) f) Report the standard deviation and returns of a portfolio that invests X% in the market portfolio and (1-X%) in the risk free rate for X ranging from 0 to 150%. (1 point). g) Explain what it means to invest 150% in the market portfolio and -50% in the risk-free rate? Would this ever be optimal? Why or why not? (1 point). h) Create a graph that plots the mean-variance frontier from part C and the capital market line in part F in one graph. Standard deviation should be on the X-axis and expected returns should be on the y-axis. In addition, the mean-variance frontier and the capital market line should be clearly labelled (2 points). i) If you wanted a return of 10%, what is the smallest possible standard deviation you could have? (1 point). j) What are the returns of the equity fund, the bond fund, and the market as predicted by the CML? How do these values compare to the actual returns on each asset. Does this difference makes sense? (2 points)
Step by Step Solution
There are 3 Steps involved in it

Get step-by-step solutions from verified subject matter experts