Question: Use excel and show equations solve using: 1. Aggregate plan using CHASE strategy. 2. Aggregate plan using LEVEL strategy. 3. Aggregate plan using MIXED strategy.

Use excel and show equations
solve using:
1. Aggregate plan using CHASE strategy.
2. Aggregate plan using LEVEL strategy.
3. Aggregate plan using MIXED strategy. Use excel and show equations solve using: 1.
Use excel and show equations solve using: 1.
Demand ('000 units) MONTHLY DEMAND FORECAST (000 BOARD FEET) Exhibit 2 COST SUMMARY (PER 1000 BOARD FEET) Green Mills Inc. operated several lumber mills throughout the Northwestern United States that produced a variety of wood products. The management was considering the possibility of a backward vertical integration strategy through the purchase of forestlands. This initiative was due, in part, to the escalating costs for raw wood. Green Mills procured raw softwoods locally at $400 per thousand board feet. However, there existed an opportunity to purchase forestlands in Chile with an estimated production cost of $150 per thousand board feet. The cost for transporting lumber from Chile averaged $50 per thousand board feet. The maximum available shipping capacity was 1,500,000 board feet per month. The lead-time for harvesting and shipping raw wood from Chile to Green Mills was one month. The operations manager was interested in developing a minimum total cost aggregate plan for producing raw lumber from Chile in the amounts needed by Green Mills. Specifically, the manager wanted to contrast the costs associated with a chase plan, a level plan and a mixed aggregate plan. 1 Monthly demand projections were developed using a time series forecasting system that combined the expected monthly orders of each of the company's five mills. The demand forecast (thousands of board feet) for the next 12 months is reported in Exhibit 1. In Chile, one worker could harvest 50,000 board feet of raw lumber per month based on a 160 -hours-permonth work schedule. The forest property under consideration currently had 20 employees and a maximum inventory capacity of 3,000,000 board feet per month. In the lumber industry, workers were hired on a monthly basis. This means that undertime was paid. Overtime was limited to 25 per cent of the regular-time hours worked. Exhibit 2 summarizes the production costs. Backordering was not permitted due to the competitive nature of the lumber products market. Hiring and training costs in Chile were $1,000 per new employee. Layoff costs were $500 per employee. Exhibit 2 summarizes the various cost factors

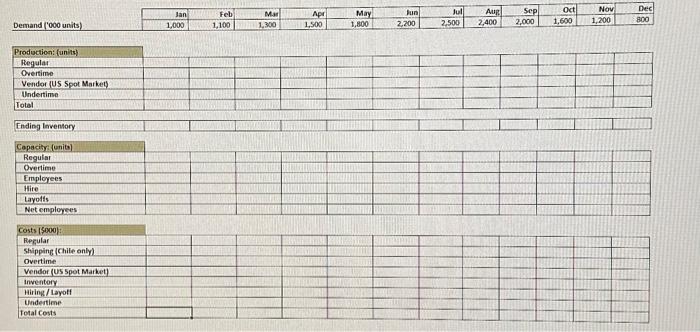
Step by Step Solution

There are 3 Steps involved in it

1 Expert Approved Answer
Step: 1 Unlock blur-text-image
Question Has Been Solved by an Expert!

Get step-by-step solutions from verified subject matter experts

Step: 2 Unlock
Step: 3 Unlock

Students Have Also Explored These Related General Management Questions!