

Question: Use Excel and the appropriate absorbance values to prepare the coordinates for your linear regression plot. Use the data from the thymol blue standard for
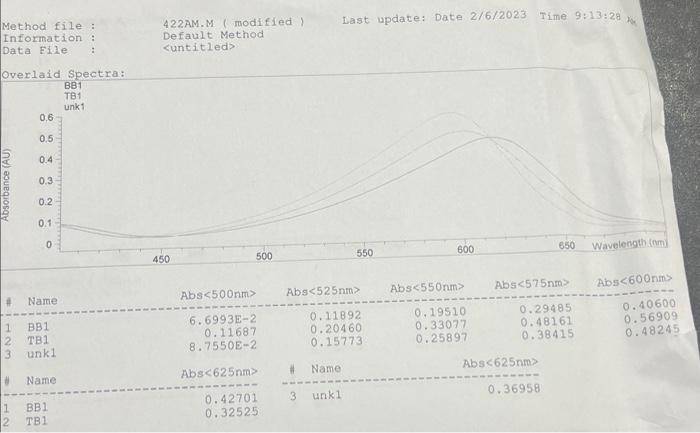
Use Excel and the appropriate absorbance values to prepare the coordinates for your linear
regression plot. Use the data from the thymol blue standard for component 1 and that from the
bromothymol blue standard for component 2. Calculate Am()/As1() and As2()/As1() at each
of the wavelengths reported by the method file. Plot Am()/As1() versus As2()/As1() and fit
the data with a linear trendline (Excel term for a best fit line).
Step by Step Solution
There are 3 Steps involved in it
1 Expert Approved Answer
Step: 1 Unlock

Question Has Been Solved by an Expert!
Get step-by-step solutions from verified subject matter experts
Step: 2 Unlock
Step: 3 Unlock