

Question: use excel Consider this data file which lists fictitious companies and their fictitious credit ratings (that look like those of S&P) at the beginning and
use excel
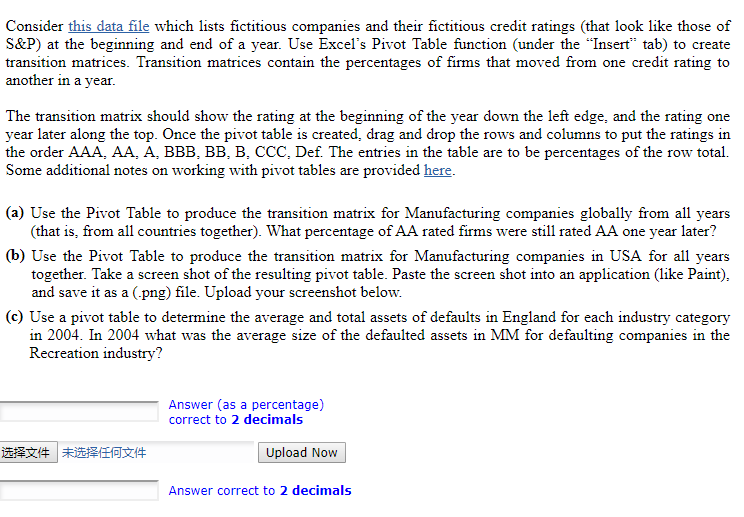
Consider this data file which lists fictitious companies and their fictitious credit ratings (that look like those of S&P) at the beginning and end of a year. Use Excel's Pivot Table function (under the "Insert" tab) to create transition matrices. Transition matrices contain the percentages of firms that moved from one credit rating to another in a year. The transition matrix should show the rating at the beginning of the year down the left edge, and the rating one year later along the top. Once the pivot table is created, drag and drop the rows and columns to put the ratings in the order AAA, AA, A, BBB, BB, B, CCC. Def. The entries in the table are to be percentages of the row total. Some additional notes on working with pivot tables are provided here. (a) Use the Pivot Table to produce the transition matrix for Manufacturing companies globally from all years (that is from all countries together). What percentage of AA rated firms were still rated AA one year later? (b) Use the Pivot Table to produce the transition matrix for Manufacturing companies in USA for all years together. Take a screen shot of the resulting pivot table. Paste the screen shot into an application (like Paint). and save it as a (.png) file. Upload your screenshot below. (c) Use a pivot table to determine the average and total assets of defaults in England for each industry category in 2004. In 2004 what was the average size of the defaulted assets in MM for defaulting companies in the Recreation industry? Answer (as a percentage) correct to 2 decimals Upload Now Answer correct to 2 decimals Consider this data file which lists fictitious companies and their fictitious credit ratings (that look like those of S&P) at the beginning and end of a year. Use Excel's Pivot Table function (under the "Insert" tab) to create transition matrices. Transition matrices contain the percentages of firms that moved from one credit rating to another in a year. The transition matrix should show the rating at the beginning of the year down the left edge, and the rating one year later along the top. Once the pivot table is created, drag and drop the rows and columns to put the ratings in the order AAA, AA, A, BBB, BB, B, CCC. Def. The entries in the table are to be percentages of the row total. Some additional notes on working with pivot tables are provided here. (a) Use the Pivot Table to produce the transition matrix for Manufacturing companies globally from all years (that is from all countries together). What percentage of AA rated firms were still rated AA one year later? (b) Use the Pivot Table to produce the transition matrix for Manufacturing companies in USA for all years together. Take a screen shot of the resulting pivot table. Paste the screen shot into an application (like Paint). and save it as a (.png) file. Upload your screenshot below. (c) Use a pivot table to determine the average and total assets of defaults in England for each industry category in 2004. In 2004 what was the average size of the defaulted assets in MM for defaulting companies in the Recreation industry? Answer (as a percentage) correct to 2 decimals Upload Now Answer correct to 2 decimals
Step by Step Solution
There are 3 Steps involved in it

Get step-by-step solutions from verified subject matter experts