

Question: use excel D co a Open in desktop app 88 Tools 1. Your annual salary is $200,000. You are offered two options for a severance
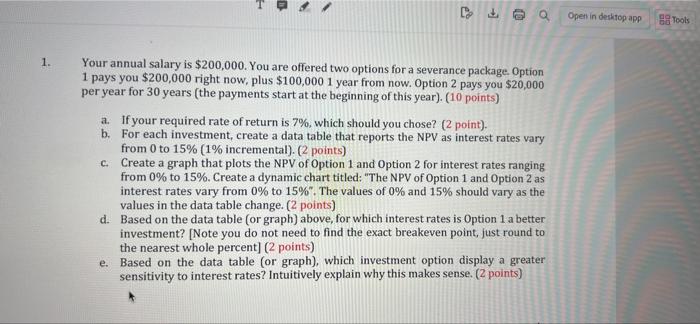
D co a Open in desktop app 88 Tools 1. Your annual salary is $200,000. You are offered two options for a severance package. Option 1 pays you $200,000 right now, plus $100,000 1 year from now. Option 2 pays you $20,000 per year for 30 years (the payments start at the beginning of this year). (10 points) a. If your required rate of return is 7%, which should you chose? (2 point). b. For each investment, create a data table that reports the NPV as interest rates vary from 0 to 15% (1% incremental). (2 points) c. Create a graph that plots the NPV of Option 1 and Option 2 for interest rates ranging from 0% to 15%. Create a dynamic chart titled: "The NPV of Option 1 and Option 2 as interest rates vary from 0% to 15%". The values of 0% and 15% should vary as the values in the data table change. (2 points) d. Based on the data table (or graph) above, for which interest rates is Option 1 a better investment? [Note you do not need to find the exact breakeven point, just round to the nearest whole percent] (2 points) e. Based on the data table (or graph), which investment option display a greater sensitivity to interest rates? Intuitively explain why this makes sense. (2 points) D co a Open in desktop app 88 Tools 1. Your annual salary is $200,000. You are offered two options for a severance package. Option 1 pays you $200,000 right now, plus $100,000 1 year from now. Option 2 pays you $20,000 per year for 30 years (the payments start at the beginning of this year). (10 points) a. If your required rate of return is 7%, which should you chose? (2 point). b. For each investment, create a data table that reports the NPV as interest rates vary from 0 to 15% (1% incremental). (2 points) c. Create a graph that plots the NPV of Option 1 and Option 2 for interest rates ranging from 0% to 15%. Create a dynamic chart titled: "The NPV of Option 1 and Option 2 as interest rates vary from 0% to 15%". The values of 0% and 15% should vary as the values in the data table change. (2 points) d. Based on the data table (or graph) above, for which interest rates is Option 1 a better investment? [Note you do not need to find the exact breakeven point, just round to the nearest whole percent] (2 points) e. Based on the data table (or graph), which investment option display a greater sensitivity to interest rates? Intuitively explain why this makes sense. (2 points)
Step by Step Solution
There are 3 Steps involved in it

Get step-by-step solutions from verified subject matter experts