

Question: Use excel for A-C. Show steps in making graph for excel.. Thank you. 8. The following payoff table shows the profit for a decision problem
Use excel for A-C. Show steps in making graph for excel.. Thank you.
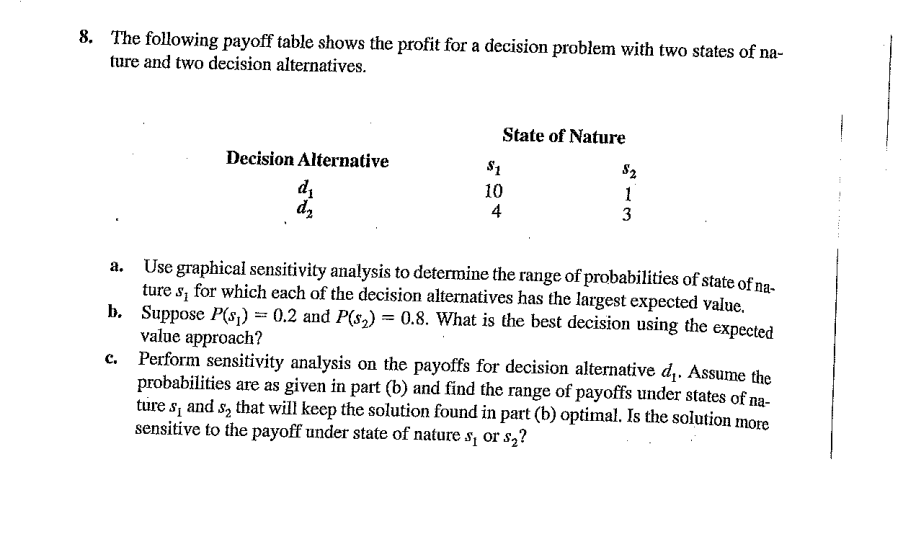
8. The following payoff table shows the profit for a decision problem with two states of na- ture and two decision alternatives. State of Nature Decision Alternative $1 $2 d 10 1 d 4 3 a. Use graphical sensitivity analysis to determine the range of probabilities of state of na- tures, for which each of the decision alternatives has the largest expected value. Suppose P(s) = 0.2 and P(s) = 0.8. What is the best decision using the expected value approach? b. c. Perform sensitivity analysis on the payoffs for decision alternative d. Assume the probabilities are as given in part (b) and find the range of payoffs under states of na- tures, and so that will keep the solution found in part (b) optimal. Is the solution more sensitive to the payoff under state of nature s, or sStep by Step Solution
There are 3 Steps involved in it
1 Expert Approved Answer
Step: 1 Unlock

Question Has Been Solved by an Expert!
Get step-by-step solutions from verified subject matter experts
Step: 2 Unlock
Step: 3 Unlock