

Question: use Excel format wrong Answer 10250 10000 Estimated Marginal Means 9750 9500 9250 Colour of the packing - blue yellow blue Chocolate Choc Beethoven Dream
use Excel format
wrong Answer
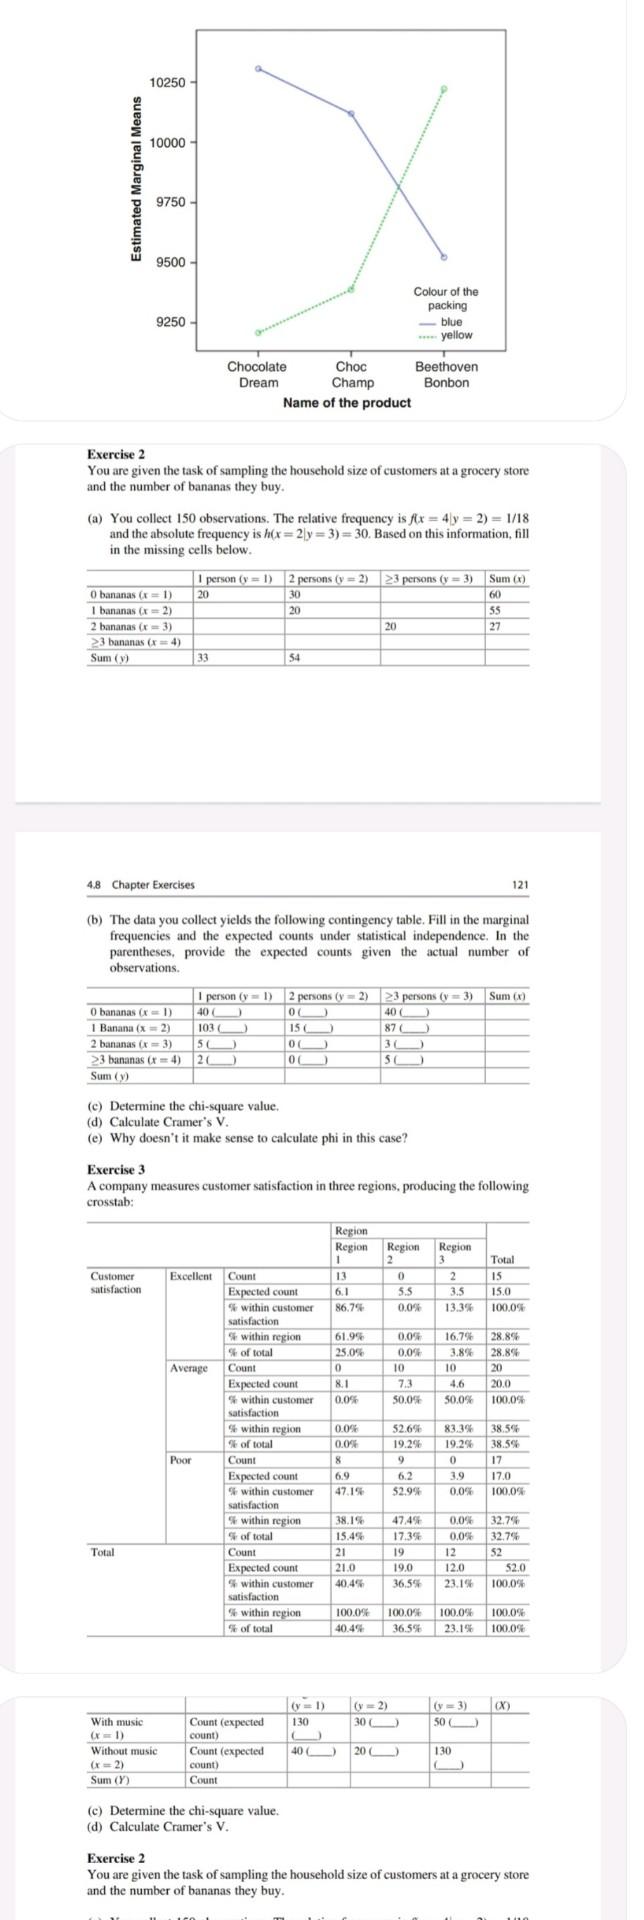
10250 10000 Estimated Marginal Means 9750 9500 9250 Colour of the packing - blue yellow blue Chocolate Choc Beethoven Dream Champ Bonbon Name of the product Exercise 2 2 You are given the task of sampling the household size of customers at a grocery store and the number of bananas they buy. (a) You collect 150 observations. The relative frequency is fix = 4y= 2)=1/18 and the absolute frequency is h(x = 2y = 3) = 30. Based on this information, fill in the missing cells below. 1 person (y = 1) 20 30 20 2 persons (y = 2) 23 persons (y - 3) Sum (1) 60 SS O bananas ( x1) 1 bananas x=2) 2 bananas (3) >3 bananas ( x4) Sum () 20 27 33 54 4.8 Chapter Exercises 121 (b) The data you collect yields the following contingency table. Fill in the marginal frequencies and the expected counts under statistical independence. In the parentheses, provide the expected counts given the actual number of observations. I person (y = 1) 2 persons (y = 2) 23 persons (y - 3) Sum(x) O bananas (x = 1) 04 400 1 Banana (x - 2) 103 15 87 2 bananas ( x3) 50 00 23 bananas (x = 4) 2 20 SC Sum (y) 40 ) ) ) ) ) ) ) 01 (e) Determine the chi-square value, (d) Calculate Cramer's V. (e) Why doesn't it make sense to calculate phi in this case? Exercise 3 A company measures customer satisfaction in three regions, producing the following crosstab: Customer satisfaction Region Region Region Region 2 3 13 0 2 6.1 SS 3.5 86.74 0.0% 13.3% Total 15 15.0 100.0% Excellent Count Expected count within customer satisfaction within region of total Average Count Expected count s within customer satisfaction 61.94 25.0% 0 8.1 0.04 0.0% 0.0% 10 7.3 50.05 16.796 3.8% 10 4.6 50.0% 28.89 28.8% 20 20.0 100.05 52.62 within region of total Count 38.55 38.5% % Poor Poor 0.0% 0.0% 8 6.9 47.1% 19.29 9 6.2 52.9% 83.396 19.2% 0 3.9 0.0% 17.0 100.0% Total Expected count within customer satisfaction within region % of total Count Expected count within customer satisfaction within region of total 38.1% 15.4% 21 21.0 40.4% 47,49 17.39 19 19.0 36.5% 0.0% 0.09 12 12.0 23.1% 32.7% 32.79 % 52 52.0 100.0% % 100.0% 40.44 100.00 36.5% 100.0% 23.1% 100.0% 100.0% CX) (2) 30 ) 6 = 3) 50 ) With music 130 Count (expected count) Count (expected count) Count 40 O 20 ) Without music (x=2) Sum (Y) 130 (c) Determine the chi-square value. (d) Calculate Cramer's V. Exercise 2 You are given the task of sampling the household size of customers at a grocery store and the number of bananas they buy. 101Step by Step Solution
There are 3 Steps involved in it
1 Expert Approved Answer
Step: 1 Unlock

Question Has Been Solved by an Expert!
Get step-by-step solutions from verified subject matter experts
Step: 2 Unlock
Step: 3 Unlock