

Question: Use Excel functions to answer this question Recalculate the value per share in cell D31, based on mid-year discounting (with a nominal conversion of the
Use Excel functions to answer this question
Recalculate the value per share in cell D31, based on mid-year discounting (with a nominal conversion of the annual discount rate) of the FCFs
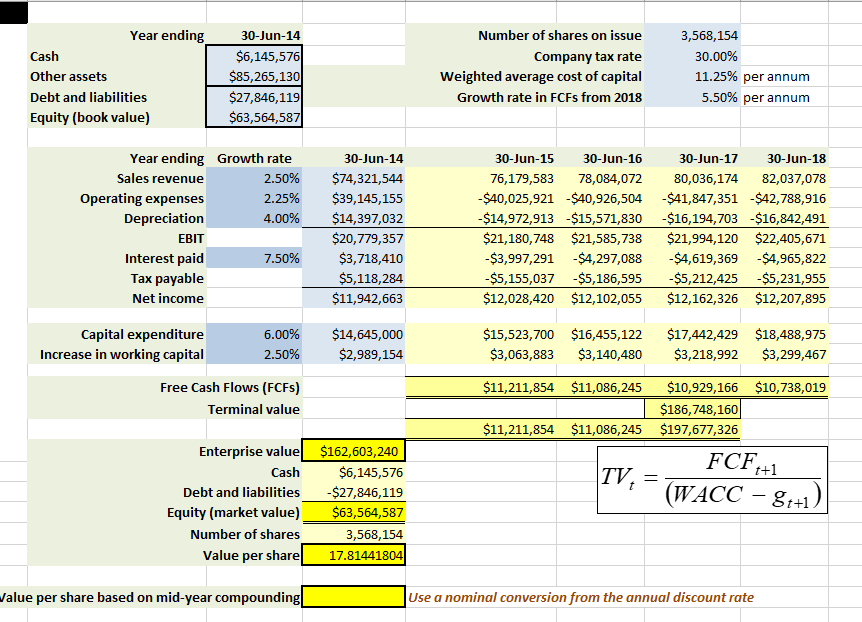
Year ending Cash Other assets Debt and liabilities Equity (book value) 30-Jun-14 $6,145,576 $85,265,130 $27,846,119 $63,564,587 Number of shares on issue Company tax rate Weighted average cost of capital Growth rate in FCFs from 2018 3,568,154 30.00% 11.25% per annum 5.50% per annum Year ending Growth rate Sales revenue 2.50% Operating expenses 2.25% Depreciation 4.00% EBIT Interest paid 7.50% Tax payable Net income 30-Jun-14 $74,321,544 $39,145,155 $14,397,032 $20,779,357 $3,718,410 $5,118,284 $11,942,663 30-Jun-15 30-Jun-16 76,179,583 78,084,072 -$40,025,921 -$40,926,504 -$14,972,913 -$15,571,830 $21,180,748 $21,585,738 $3,997,291 -$4,297,088 -$5,155,037 - $5,186,595 $12,028,420 $12, 102,055 30-Jun-17 30-Jun-18 80,036,174 82,037,078 -$41,847,351 $42,788,916 $16,194,703 $16,842,491 $21,994,120 $22,405,671 -$4,619,369 -$4,965,822 $5,212,425 $5,231,955 $12,162,326 $12,207,895 $14,645,000 $2,989,154 $15,523,700 $16,455,122 $3,063,883 $3,140,480 $17,442,429 $18,488,975 $3,218,992 $3,299,467 Capital expenditure 6.00% Increase in working capital 2.50% Free Cash Flows (FCFS) Terminal value $11,211,854 $11,086,245 $10,929,166 $10,738,019 $186,748,160 $11,211,854 $11,086,245 $197,677,326 FCF +1 (WACC 87+1) TV Enterprise value $162,603,240 Cash $6,145,576 Debt and liabilities -$27,846,119 Equity (market value) $63,564,587 Number of shares 3,568,154 Value per share 17.81441804 = Value per share based on mid-year compounding| Use a nominal conversion from the annual discount rate Year ending Cash Other assets Debt and liabilities Equity (book value) 30-Jun-14 $6,145,576 $85,265,130 $27,846,119 $63,564,587 Number of shares on issue Company tax rate Weighted average cost of capital Growth rate in FCFs from 2018 3,568,154 30.00% 11.25% per annum 5.50% per annum Year ending Growth rate Sales revenue 2.50% Operating expenses 2.25% Depreciation 4.00% EBIT Interest paid 7.50% Tax payable Net income 30-Jun-14 $74,321,544 $39,145,155 $14,397,032 $20,779,357 $3,718,410 $5,118,284 $11,942,663 30-Jun-15 30-Jun-16 76,179,583 78,084,072 -$40,025,921 -$40,926,504 -$14,972,913 -$15,571,830 $21,180,748 $21,585,738 $3,997,291 -$4,297,088 -$5,155,037 - $5,186,595 $12,028,420 $12, 102,055 30-Jun-17 30-Jun-18 80,036,174 82,037,078 -$41,847,351 $42,788,916 $16,194,703 $16,842,491 $21,994,120 $22,405,671 -$4,619,369 -$4,965,822 $5,212,425 $5,231,955 $12,162,326 $12,207,895 $14,645,000 $2,989,154 $15,523,700 $16,455,122 $3,063,883 $3,140,480 $17,442,429 $18,488,975 $3,218,992 $3,299,467 Capital expenditure 6.00% Increase in working capital 2.50% Free Cash Flows (FCFS) Terminal value $11,211,854 $11,086,245 $10,929,166 $10,738,019 $186,748,160 $11,211,854 $11,086,245 $197,677,326 FCF +1 (WACC 87+1) TV Enterprise value $162,603,240 Cash $6,145,576 Debt and liabilities -$27,846,119 Equity (market value) $63,564,587 Number of shares 3,568,154 Value per share 17.81441804 = Value per share based on mid-year compounding| Use a nominal conversion from the annual discount rate
Step by Step Solution
There are 3 Steps involved in it

Get step-by-step solutions from verified subject matter experts