

Question: Use excel functions/ tools to calculate the correlation coefficient, the value of the rest statistics and Pvalue. Also use excel to generate a scatter plot
Use excel functions/ tools to calculate the correlation coefficient, the value of the rest statistics and Pvalue. Also use excel to generate a scatter plot with a linear regression line.
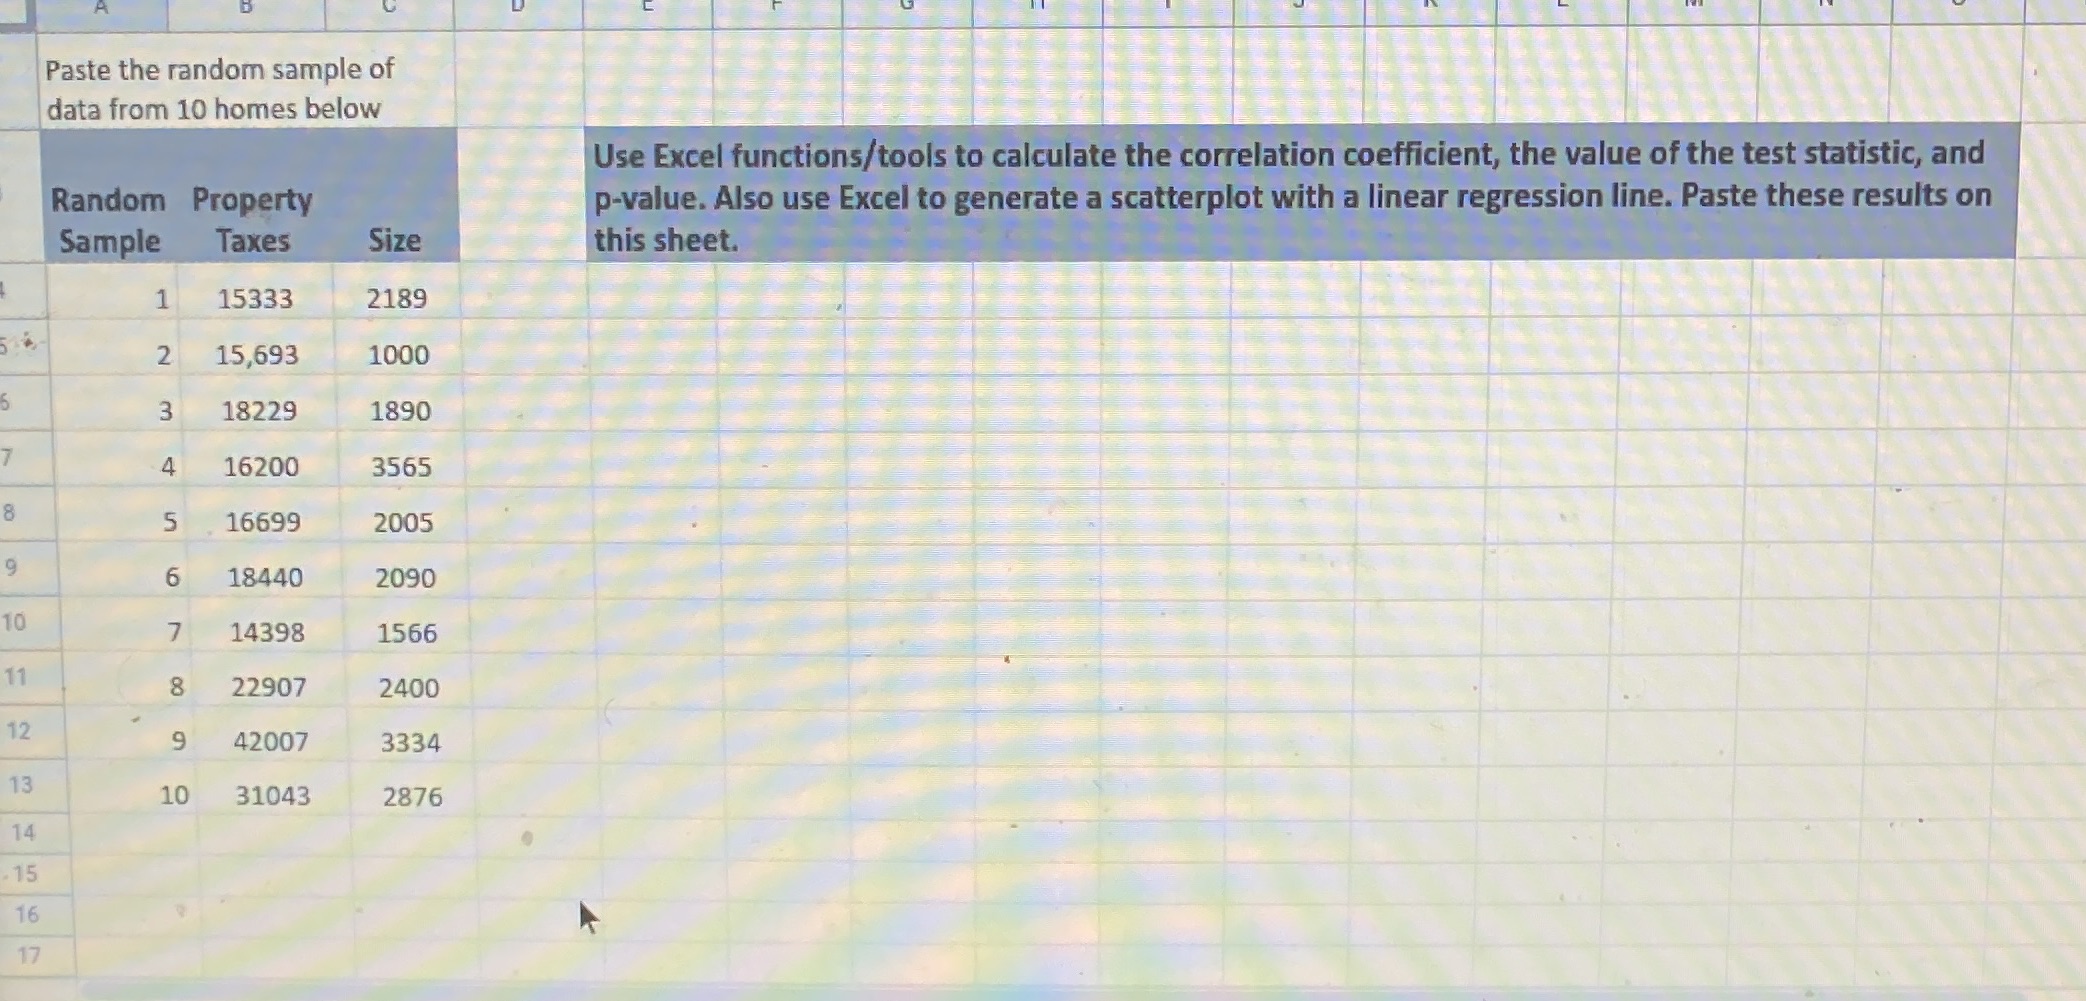
Paste the random sample of data from 10 homes below Use Excel functions/tools to calculate the correlation coefficient, the value of the test statistic, and Random Property p-value. Also use Excel to generate a scatterplot with a linear regression line. Paste these results on Sample Taxes Size this sheet. 15333 2189 2 15,693 1000 3 18229 1890 4 16200 3565 5 16699 2005 6 18440 2090 10 7 14398 1566 11 8 22907 2400 12 9 42007 3334 13 10 31043 2876 14 15 16 17
Step by Step Solution
There are 3 Steps involved in it

Get step-by-step solutions from verified subject matter experts