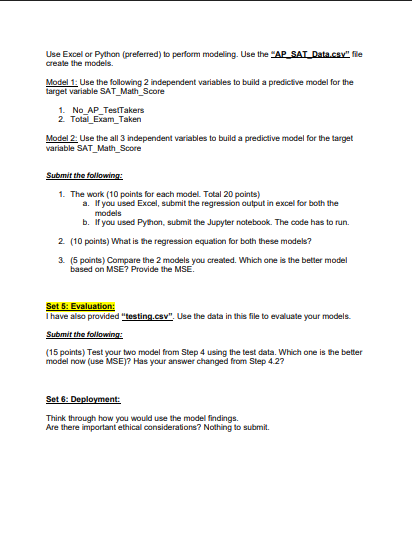
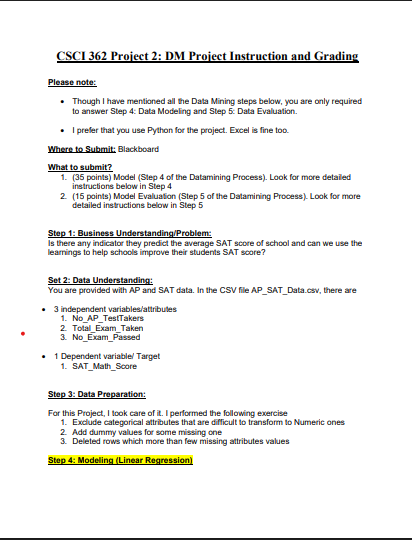
Question: Use Excel or Python (preferred) to perform modeling. Use the AP_SAT_Data cey file create the models. Model 1: Use the following 2 independent variables to

Use Excel or Python (preferred) to performUse Excel or Python (preferred) to perform
Use Excel or Python (preferred) to perform modeling. Use the "AP_SAT_Data cey" file create the models. Model 1: Use the following 2 independent variables to build a predictive model for the larget variable SAT_Math_Score 1. No AP TesiTakers 2. Total Exam_Taken Model 2: Use the all 3 independent variables to build a prediclive model for the larget variable SAT Math_Score Submit the following: 1. The work (10 points for each model. Total 20 points) a. If you used Excel, submit the regression output in excel for both the models b. If you used Python, submit the Jupyter notebook. The code has to run. 2. (10 points) What is the regression equation for both these models? 3. (5 points) Compare the 2 models you created. Which one is the beller model based on MSE7 Provide the MSE. Set 5: Evaluation: I have also provided "testing.esv". Use the data in this file to evaluate your models. Submit the following: (15 points) Test your two model from Step 4 using the test data. Which one is the better model now (use MSE)? Has your answer changed from Step 4.27 Set 6: Deployment: Think through how you would use the model findings. Are there important ethical considerations? Nothing to submit.CSCI 362 Project 2: DM Project Instruction and Grading Please note: Though I have mentioned all the Data Mining steps below, you are only required to answer Step 4: Data Modeling and Step 5: Data Evaluation. I prefer that you use Python for the project. Excel is fine too. Where to Submit: Blackboard What to submit? 1. (35 points) Model (Siep 4 of the Datamining Process). Look for more detailed instructions below in Step 4 2. (15 points) Model Evaluation (Step 5 of the Datamining Process). Look for more detailed instructions below in Step 5 Step 1: Business Understanding/Problem: Is there any indicator they predict the average SAT score of school and can we use the learnings to help schools improve their students SAT score? Set 2: Data Understanding: You are provided with AP and SAT data. In the CSV file AP_SAT_Data.esv, there are 3 independent variables/attributes 1. No AP TestTakers 2. Total Exam Taken 3. No Exam_Passed 1 Dependent variable/ Target 1. SAT Math_Score Stop 3: Data Preparation: For this Project, I look care of it. I performed the following exercise 1. Exclude categorical altributes that are difficult to transform to Numeric ones 2. Add dummy values for some missing one 3. Deleted rows which more than few missing altributes values Stop 4: Modeling[Linear Regression)

Step by Step Solution

There are 3 Steps involved in it

1 Expert Approved Answer
Step: 1 Unlock blur-text-image
Question Has Been Solved by an Expert!

Get step-by-step solutions from verified subject matter experts

Step: 2 Unlock
Step: 3 Unlock

Students Have Also Explored These Related Mathematics Questions!