

Question: Use excel qm or excel. Present formulas and solution, graph. Sales forecast Forecast next (day) period using 1-Feb 16 1. 16-Feb 8 Naive forecasting model;
Use excel qm or excel. Present formulas and solution, graph.
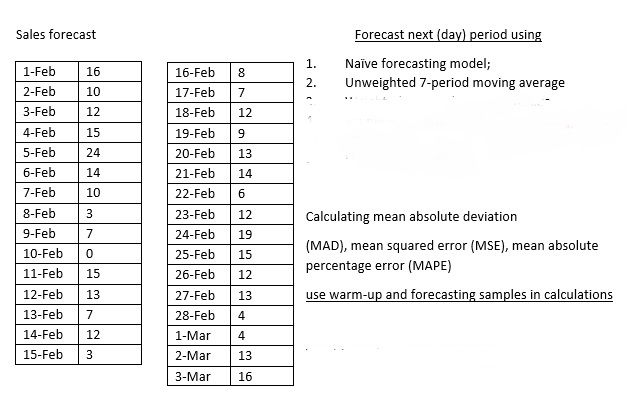
Sales forecast Forecast next (day) period using 1-Feb 16 1. 16-Feb 8 Naive forecasting model; 2. 2-Feb 10 17-Feb 7 Unweighted 7-period moving average 3-Feb 12 18-Feb 12 4-Feb 15 19-Feb 9 5-Feb 24 20-Feb 13 6-Feb 14 21-Feb 14 7-Feb 10 22-Feb 6 8-Feb 3 23-Feb 12 Calculating mean absolute deviation 9-Feb 7 24-Feb 19 10-Feb 0 25-Feb 15 (MAD), mean squared error (MSE), mean absolute 11-Feb 15 26-Feb 12 percentage error (MAPE) 12-Feb 13 27-Feb 13 use warm-up and forecasting samples in calculations 13-Feb 7 28-Feb 4 14-Feb 12 1-Mar 4 15-Feb 3 2-Mar 13 3-Mar 16
Step by Step Solution
There are 3 Steps involved in it
1 Expert Approved Answer
Step: 1 Unlock

Question Has Been Solved by an Expert!
Get step-by-step solutions from verified subject matter experts
Step: 2 Unlock
Step: 3 Unlock