

Question: use excel sheet P3-25 Integrative: Complete ratio analysis Given the following financial statements (following and on the next page), historical ratios, and industry averages, calculate
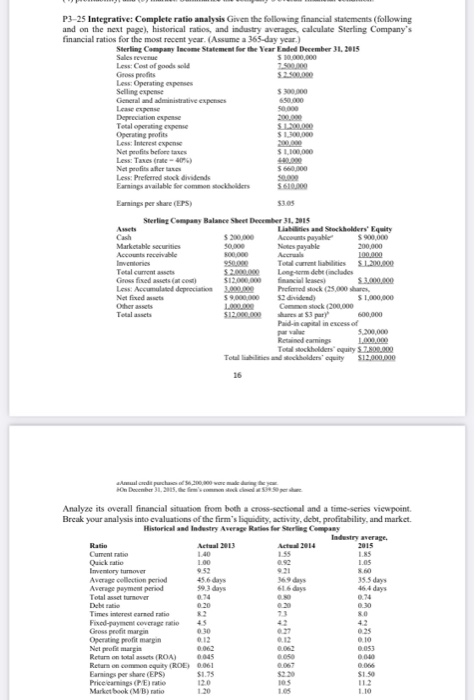
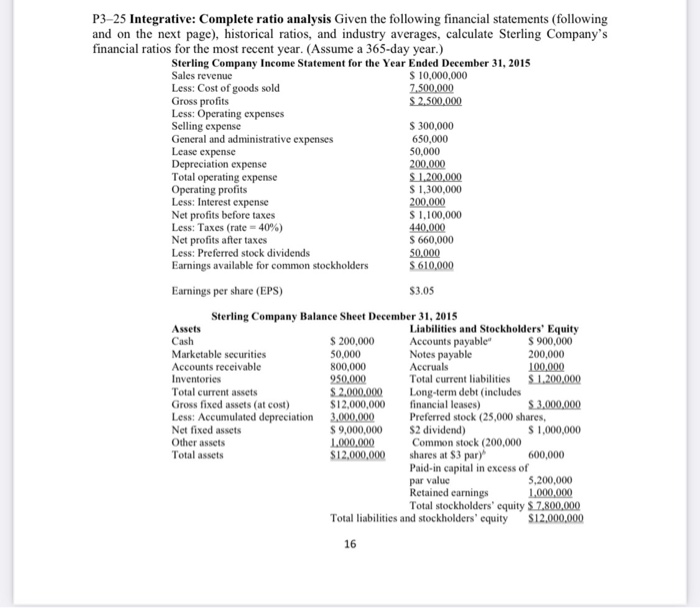
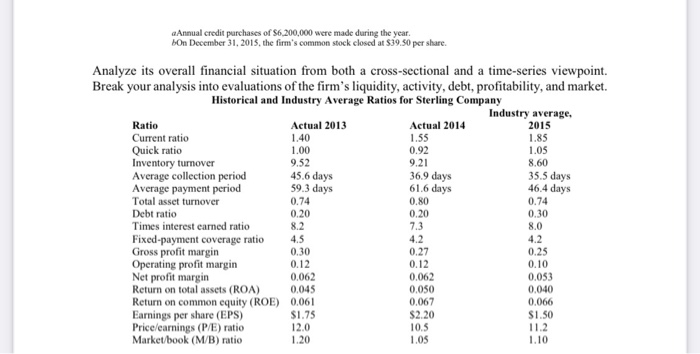
P3-25 Integrative: Complete ratio analysis Given the following financial statements (following and on the next page), historical ratios, and industry averages, calculate Sterling Company's financial ratios for the most recent year. (Assume a 365-day year.) Sterling Company Income Statement for the Year Ended December 31, 2015 Salles revenue $10.000.000 Less: Cost of goods sold 7500 Gross profits 5 2.500.000 Less Operating expenses 500.00 Selling expense General administrative expenses Lesene Depreciation expo Total operating expense Operating profits S1300.000 Less Interest expense Net profits before taxes $ 1.100.000 Less: Taxes (rate-407) Net profits there 660,000 Less: Preferred stock dividends Earnings available for common stockholders 5 610400 Earnings per share (EPS) Sterling Company Balance Sheet December 31, 2015 Liabilities and Stockholders' quity $ 200,000 Accounts payable $900,000 Marketable securities Notes payable 200,000 Accounts receivable Accra 100.000 Inventories Total current liabilities SL210.000 Total current 52. Long-term det includes Gross fixed assets at cost) $12.000.000 fancies) $3.000.000 Less Accumulated depreciation 3.000.000 Preferred stock (25,000 shares Net fixed $ 9,000,000 $2.dividend $ 1.000.000 Others Cestock (200.000 Total assets $12.000.000 hrs 53 pary 600,000 Paid in capital in excess of para 3.300.000 Retained caring Total stockholders' equity 5.7.800.000 Totale holdersity $12.000.000 16 On December 31, 2015 Analyze its overall financial situation from both a cross-sectional and a time-series viewpoint. Break your analysis into evaluations of the firm's liquidity, activity, debt, profitability, and market. Historical and Industry Average Rates for Sterling Company Industry average Ratio Actual 2013 2015 Current ratio 1.40 1.55 LS Quick ratio 1.00 1.0 Inventory tumover 8.00 Average collection period 456 35.5 days Average payment period 616 days Totalans over . 0.74 Delta 0.30 Times interest earned ratio 80 Fixed-payment coverage ratio Gross profit margin 0.30 Operating profit margin 0.12 0.10 Net profit margin Return on last (ROA) 0045 0.000 Return on common equity (RDE) 0.061 Earnings por share (EPS) S1.5 $1.50 Price learnings (P/E) ratio 105 112 Market book (MB) ratio 1.20 1.05 1.10 90.3 days 0.053 050 0.05 P325 Integrative: Complete ratio analysis Given the following financial statements (following and on the next page), historical ratios, and industry averages, calculate Sterling Company's financial ratios for the most recent year. (Assume a 365-day year.) Sterling Company Income Statement for the Year Ended December 31, 2015 Sales revenue $ 10,000,000 Less: Cost of goods sold 7.500.000 Gross profits $ 2.500.000 Less: Operating expenses Selling expense $ 300,000 General and administrative expenses 650,000 Lease expense 50,000 Depreciation expense 200.000 Total operating expense $ 1.200.000 Operating profits $ 1,300,000 Less: Interest expense 200,000 Net profits before taxes $ 1,100,000 Less: Taxes (rate=40%) 440,000 Net profits after taxes S 660,000 Less: Preferred stock dividends 50,000 Earnings available for common stockholders S 610,000 Earnings per share (EPS) $3.05 Sterling Company Balance Sheet December 31, 2015 Assets Liabilities and Stockholders' Equity Cash $ 200,000 Accounts payable" $ 900,000 Marketable securities 50,000 Notes payable 200,000 Accounts receivable 800,000 Accruals 100.000 Inventories 950.000 Total current liabilities $ 1.200.000 Total current assets $ 2.000.000 Long-term debt (includes Gross fixed assets (at cost) $12,000,000 financial leases) $ 3.000.000 Less: Accumulated depreciation 3,000,000 Preferred stock (25,000 shares, Net fixed assets $ 9,000,000 $2 dividend) $ 1,000,000 Other assets 1.000.000 Common stock (200,000 Total assets $12,000,000 shares at $3 pary 600,000 Paid-in capital in excess of par value 5,200,000 Retained earnings 1,000,000 Total stockholders' equity S 7.800.000 Total liabilities and stockholders' equity $12.000.000 16 a Annual credit purchases of S6,200,000 were made during the year. bOn December 31, 2015, the firm's common stock closed at $39.50 per share. Analyze its overall financial situation from both a cross-sectional and a time-series viewpoint. Break your analysis into evaluations of the firm's liquidity, activity, debt, profitability, and market. Historical and Industry Average Ratios for Sterling Company Industry average Ratio Actual 2013 Actual 2014 2015 Current ratio 1.40 1.55 1.85 Quick ratio 1.00 0.92 1.05 Inventory turnover 9.52 9.21 8.60 Average collection period 45.6 days 36.9 days Average payment period 35.5 days 59.3 days 61.6 days 46.4 days Total asset turnover 0.74 0.80 0.74 Debt ratio 0.20 0.20 0.30 Times interest earned ratio 8.2 7.3 8.0 Fixed-payment coverage ratio 4.5 4.2 4.2 Gross profit margin 0.30 0.27 0.25 Operating profit margin 0.12 0.12 0.10 Net profit margin 0.062 0.062 0.053 Return on total assets (ROA) 0.045 0.050 0.040 Return on common equity (ROE) 0.061 0.067 0.066 Earnings per share (EPS) $1.75 $2.20 $1.50 Price/earnings (P/E) ratio 12.0 10.5 11.2 Market/book (M/B) ratio 1.20 1.05 1.10 P3-25 Integrative: Complete ratio analysis Given the following financial statements (following and on the next page), historical ratios, and industry averages, calculate Sterling Company's financial ratios for the most recent year. (Assume a 365-day year.) Sterling Company Income Statement for the Year Ended December 31, 2015 Salles revenue $10.000.000 Less: Cost of goods sold 7500 Gross profits 5 2.500.000 Less Operating expenses 500.00 Selling expense General administrative expenses Lesene Depreciation expo Total operating expense Operating profits S1300.000 Less Interest expense Net profits before taxes $ 1.100.000 Less: Taxes (rate-407) Net profits there 660,000 Less: Preferred stock dividends Earnings available for common stockholders 5 610400 Earnings per share (EPS) Sterling Company Balance Sheet December 31, 2015 Liabilities and Stockholders' quity $ 200,000 Accounts payable $900,000 Marketable securities Notes payable 200,000 Accounts receivable Accra 100.000 Inventories Total current liabilities SL210.000 Total current 52. Long-term det includes Gross fixed assets at cost) $12.000.000 fancies) $3.000.000 Less Accumulated depreciation 3.000.000 Preferred stock (25,000 shares Net fixed $ 9,000,000 $2.dividend $ 1.000.000 Others Cestock (200.000 Total assets $12.000.000 hrs 53 pary 600,000 Paid in capital in excess of para 3.300.000 Retained caring Total stockholders' equity 5.7.800.000 Totale holdersity $12.000.000 16 On December 31, 2015 Analyze its overall financial situation from both a cross-sectional and a time-series viewpoint. Break your analysis into evaluations of the firm's liquidity, activity, debt, profitability, and market. Historical and Industry Average Rates for Sterling Company Industry average Ratio Actual 2013 2015 Current ratio 1.40 1.55 LS Quick ratio 1.00 1.0 Inventory tumover 8.00 Average collection period 456 35.5 days Average payment period 616 days Totalans over . 0.74 Delta 0.30 Times interest earned ratio 80 Fixed-payment coverage ratio Gross profit margin 0.30 Operating profit margin 0.12 0.10 Net profit margin Return on last (ROA) 0045 0.000 Return on common equity (RDE) 0.061 Earnings por share (EPS) S1.5 $1.50 Price learnings (P/E) ratio 105 112 Market book (MB) ratio 1.20 1.05 1.10 90.3 days 0.053 050 0.05 P325 Integrative: Complete ratio analysis Given the following financial statements (following and on the next page), historical ratios, and industry averages, calculate Sterling Company's financial ratios for the most recent year. (Assume a 365-day year.) Sterling Company Income Statement for the Year Ended December 31, 2015 Sales revenue $ 10,000,000 Less: Cost of goods sold 7.500.000 Gross profits $ 2.500.000 Less: Operating expenses Selling expense $ 300,000 General and administrative expenses 650,000 Lease expense 50,000 Depreciation expense 200.000 Total operating expense $ 1.200.000 Operating profits $ 1,300,000 Less: Interest expense 200,000 Net profits before taxes $ 1,100,000 Less: Taxes (rate=40%) 440,000 Net profits after taxes S 660,000 Less: Preferred stock dividends 50,000 Earnings available for common stockholders S 610,000 Earnings per share (EPS) $3.05 Sterling Company Balance Sheet December 31, 2015 Assets Liabilities and Stockholders' Equity Cash $ 200,000 Accounts payable" $ 900,000 Marketable securities 50,000 Notes payable 200,000 Accounts receivable 800,000 Accruals 100.000 Inventories 950.000 Total current liabilities $ 1.200.000 Total current assets $ 2.000.000 Long-term debt (includes Gross fixed assets (at cost) $12,000,000 financial leases) $ 3.000.000 Less: Accumulated depreciation 3,000,000 Preferred stock (25,000 shares, Net fixed assets $ 9,000,000 $2 dividend) $ 1,000,000 Other assets 1.000.000 Common stock (200,000 Total assets $12,000,000 shares at $3 pary 600,000 Paid-in capital in excess of par value 5,200,000 Retained earnings 1,000,000 Total stockholders' equity S 7.800.000 Total liabilities and stockholders' equity $12.000.000 16 a Annual credit purchases of S6,200,000 were made during the year. bOn December 31, 2015, the firm's common stock closed at $39.50 per share. Analyze its overall financial situation from both a cross-sectional and a time-series viewpoint. Break your analysis into evaluations of the firm's liquidity, activity, debt, profitability, and market. Historical and Industry Average Ratios for Sterling Company Industry average Ratio Actual 2013 Actual 2014 2015 Current ratio 1.40 1.55 1.85 Quick ratio 1.00 0.92 1.05 Inventory turnover 9.52 9.21 8.60 Average collection period 45.6 days 36.9 days Average payment period 35.5 days 59.3 days 61.6 days 46.4 days Total asset turnover 0.74 0.80 0.74 Debt ratio 0.20 0.20 0.30 Times interest earned ratio 8.2 7.3 8.0 Fixed-payment coverage ratio 4.5 4.2 4.2 Gross profit margin 0.30 0.27 0.25 Operating profit margin 0.12 0.12 0.10 Net profit margin 0.062 0.062 0.053 Return on total assets (ROA) 0.045 0.050 0.040 Return on common equity (ROE) 0.061 0.067 0.066 Earnings per share (EPS) $1.75 $2.20 $1.50 Price/earnings (P/E) ratio 12.0 10.5 11.2 Market/book (M/B) ratio 1.20 1.05 1.10
Step by Step Solution
There are 3 Steps involved in it

Get step-by-step solutions from verified subject matter experts