

Question: use excel sheets to answer question (3) Prepare ratio analyses (for 2020, 2019, and 2018) for both companies. You should include the following ratios in
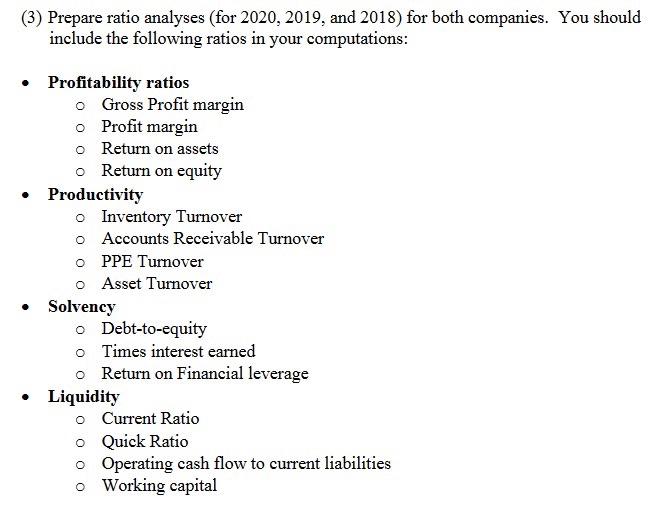
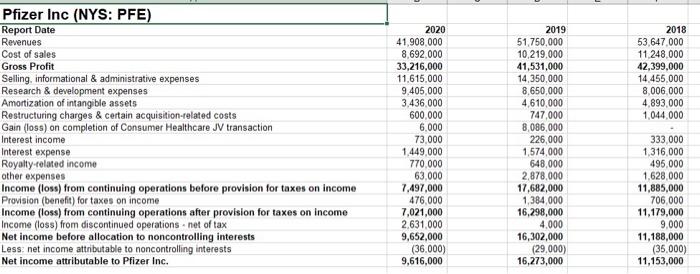
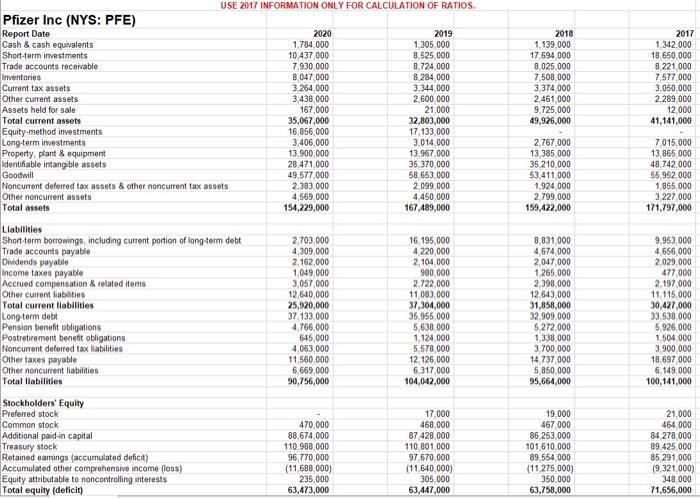
(3) Prepare ratio analyses (for 2020, 2019, and 2018) for both companies. You should include the following ratios in your computations: Profitability ratios o Gross Profit margin o Profit margin o Return on assets o Return on equity Productivity o Inventory Turnover o Accounts Receivable Turnover OPPE Turnover o Asset Turnover Solvency o Debt-to-equity o Times interest earned o Return on Financial leverage Liquidity o Current Ratio o Quick Ratio o Operating cash flow to current liabilities o Working capital 2018 53,647.000 11 248,000 42,399,000 14.455.000 8,006,000 4.893,000 1,044,000 Pfizer Inc (NYS: PFE) Report Date Revenues Cost of sales Gross Profit Selling informational & administrative expenses Research & development expenses Amortization of intangible assets Restructuring charges & certain acquisition-related costs Gain (loss) on completion of Consumer Healthcare JV transaction Interest income Interest expense Royalty-related income other expenses Income (loss) from continuing operations before provision for taxes on income Provision (benefit) for taxes on income Income (loss) from continuing operations after provision for taxes on income Income (loss) from discontinued operations - net of tax Net income before allocation to noncontrolling interests Less: net income attributable to noncontrolling interests Net income attributable to Pfizer Inc. 2020 41.908,000 8,692.000 33,216,000 11,615,000 9,405,000 3,436.000 600,000 6.000 73,000 1.449.000 770,000 63,000 7.497,000 476,000 7,021,000 2.631.000 9,652,000 (36.000) 9,616,000 2019 51,750,000 10,219.000 41,531,000 14,350,000 8,650,000 4,610,000 747,000 8,086,000 226,000 1,574,000 648,000 2,878,000 17,682,000 1,384,000 16,298,000 4.000 16,302,000 (29,000) 16,273,000 333,000 1,316,000 495.000 1,628,000 11,885,000 706.000 11,179,000 9,000 11,188,000 (35,000) 11,153,000 USE 2017 INFORMATION ONLY FOR CALCULATION OF RATIOS. Pfizer Inc (NYS: PFE) Report Date 2020 2019 Cash & cash equivalents 1.784 000 1,305.000 Short-term investments 10.437 000 8.525 000 Trade accounts receivable 7.930,000 8,724.000 Inventories 8,047.000 8 284 000 Current tax assets 3.264,000 3.344.000 Other current assets 3,438,000 2.600.000 Assets held for sale 167,000 21.000 Total current assets 35,067.000 32,803,000 Equity-method investments 16,856,000 17.133 000 Long-term investments 3,406.000 3.014 000 Property, plant & equipment 13.900.000 13 967 000 Identifiable intangible assets 28,471,000 35.370,000 Goodwill 49,577,000 58 653,000 Noncurrent deferred tax assets & other noncurrent tax assets 2.383.000 2,099.000 Other noncurrent assets 4,569 000 4 450,000 Total assets 154,229,000 167,489,000 2018 1.139.000 17,694,000 8.025 000 7.508,000 3,374,000 2.461,000 9.725,000 49.926.000 2017 1.342.000 18,650,000 8,221,000 7,577 000 3,050,000 2.289.000 12,000 41,141,000 2.767,000 13385,000 35.210,000 53.411,000 1.924 000 2,799,000 159,422,000 7.015.000 13,865 000 48.742,000 55,952,000 1,855,000 3.227.000 171.797,000 Liabilities Short-term borrowings, including current portion of long-term debt Trade accounts payable Dividends payable Income taxes payable Accrued compensation & related items Other current liabilities Total current liabilities Long term debt Pension benefit obligations Postretirement benefit obligations Noncurrent deferred tax liabilities Other taxes payable Other noncurrent liabilities Total liabilities 2,703,000 4,309,000 2. 162,000 1.049,000 3,057,000 12,640,000 25,920,000 37.133,000 4.766,000 645,000 4,063,000 11,560,000 6,669,000 90,756,000 16.195.000 4 220.000 2.104.000 980 000 2.722 000 11,083 000 37,304,000 35.955.000 5.638 000 1,124.000 5.578,000 12.126,000 6,317 000 104,042,000 8,831,000 4.674,000 2,047.000 1.265.000 2.398.000 12 643 000 31,858,000 32 909.000 5272 000 1.338.000 3.700.000 14.737.000 5,850,000 95,664,000 9.953,000 4,656,000 2029.000 477 000 2,197 000 11,115,000 30,427,000 33,538.000 5,926.000 1,504.000 3.900.000 18,697 000 6,149,000 100,141,000 Stockholders' Equity Preferred stock Common stock Additional paid-in capital Treasury stock Retained earings (accumulated delicit) Accumulated other comprehensive income foss) Equity attributable to noncontrolling interests Total equity (deficit) 470.000 88 674,000 110,988,000 96,770,000 (11,688,000) 235,000 63,473,000 17.000 468.000 87 428 000 110.801.000 97 670,000 (11 640 000) 305,000 63,447,000 19.000 467.000 86,253,000 101.610.000 89.554,000 (11 275,000) 350,000 63,758,000 21.000 464,000 84 278 000 89.425.000 85,291,000 (9.321.000) 348.000 71,656,000
Step by Step Solution
There are 3 Steps involved in it

Get step-by-step solutions from verified subject matter experts