

Question: Use EXCEL to answer the question . See the excel file and solve the Q5 sheets (Q5-mean and range charts & Q5 p-chart). a. Computer
 Use EXCEL to answer the question. See the excel file and solve the Q5 sheets (Q5-mean and range charts & Q5 p-chart).
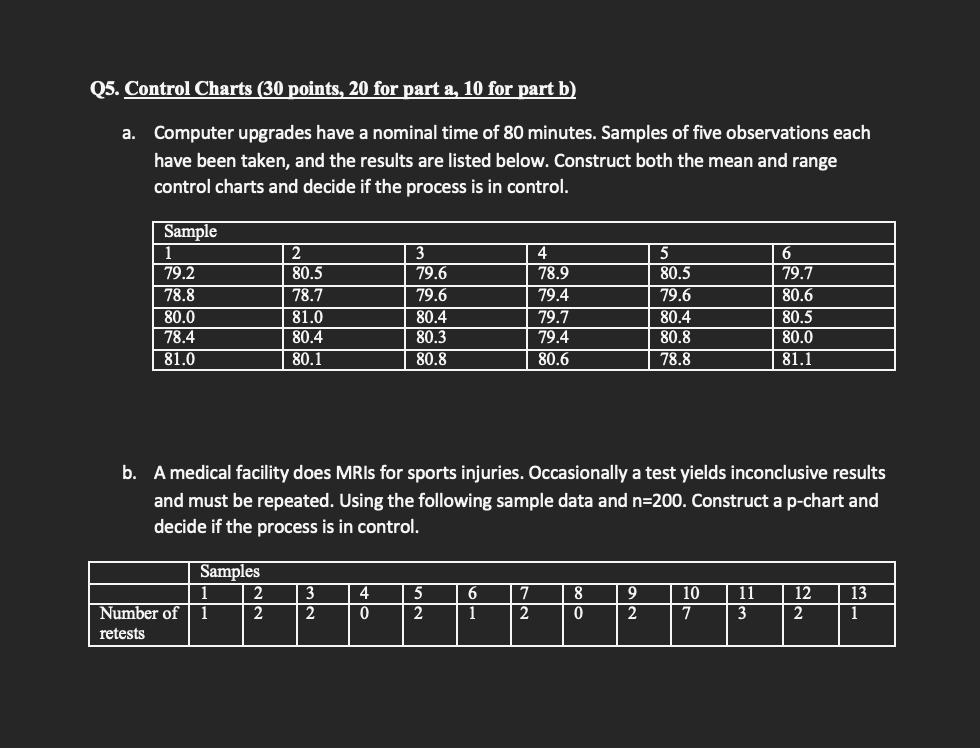
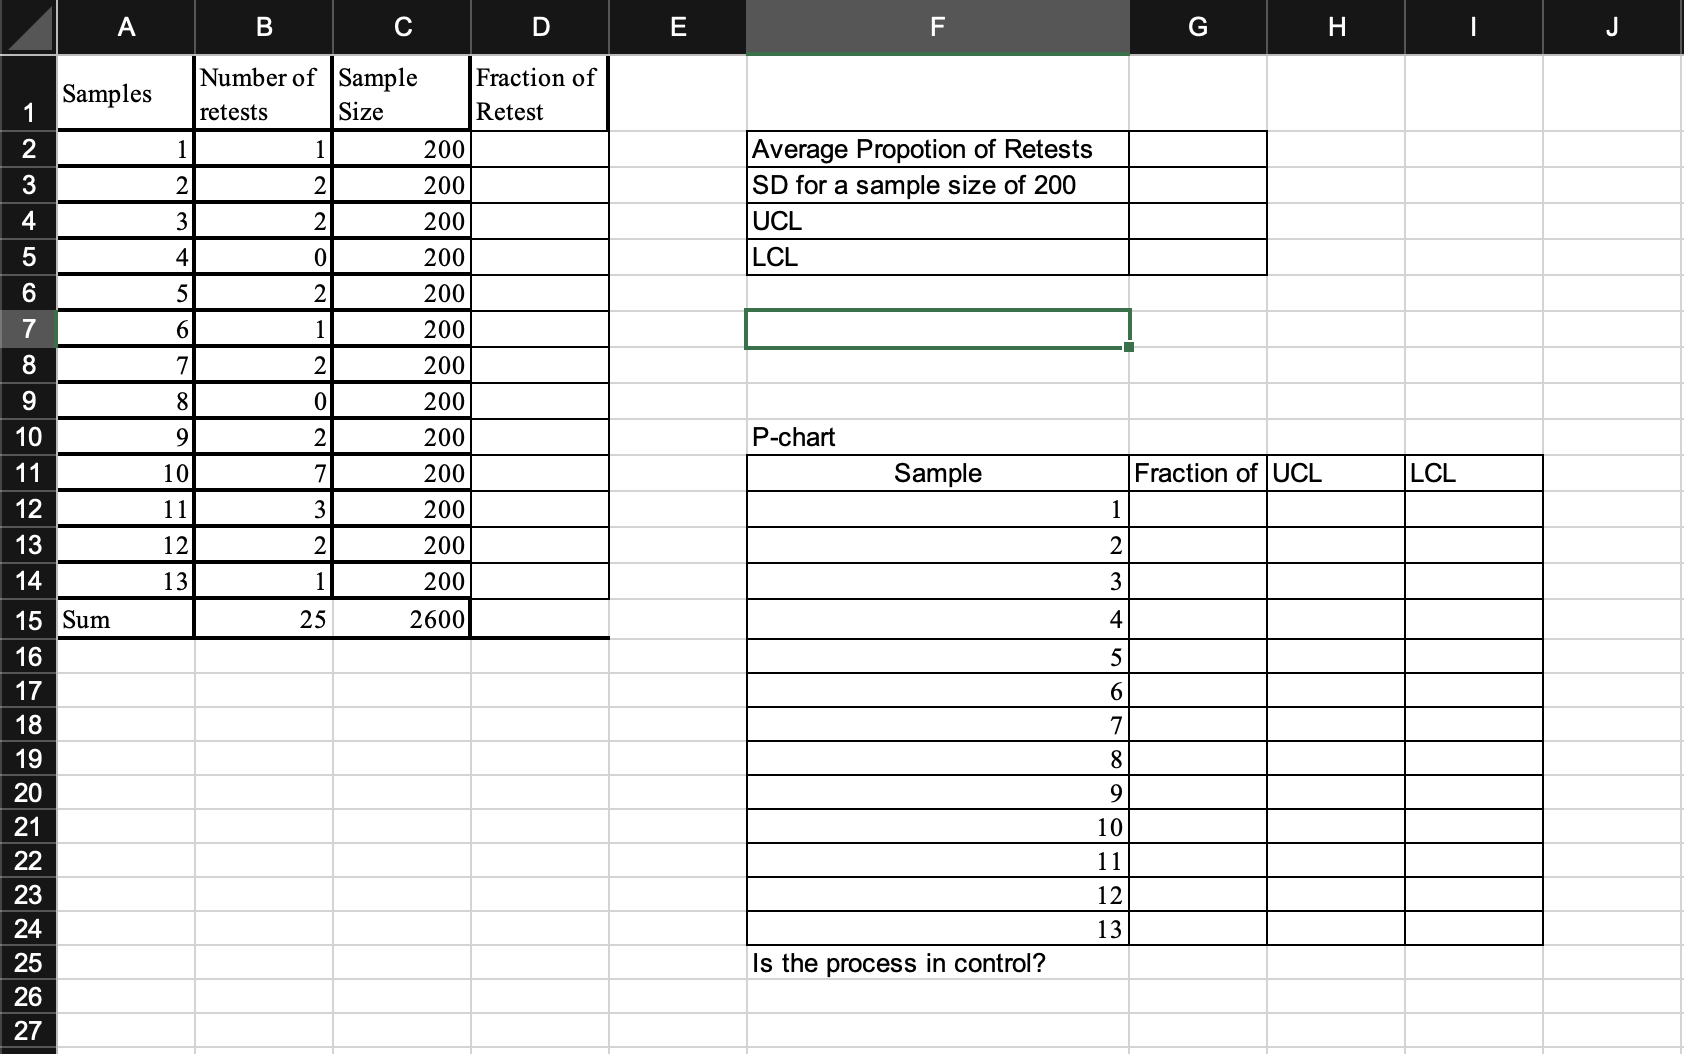
a. Computer upgrades have a nominal time of 80 minutes. Samples of five observations each have been taken, and the results are listed below. Construct both the mean and range control charts and decide if the process is in control. b. A medical facility does MRIs for sports injuries. Occasionally a test yields inconclusive results and must be repeated. Using the following sample data and n=200. Construct a p-chart and decide if the process is in control. \begin{tabular}{|c|c|c|c|c|} \hline 1 & Samples & Numberofretests & SampleSize & FractionofRetest \\ \hline 2 & 1 & 1 & 200 & \\ \hline 3 & 2 & 2 & 200 & \\ \hline 4 & 3 & 2 & 200 & \\ \hline 5 & 4 & 0 & 200 & \\ \hline 6 & 5 & 2 & 200 & \\ \hline 7 & 6 & 1 & 200 & \\ \hline 8 & 7 & 2 & 200 & \\ \hline 9 & 8 & 0 & 200 & \\ \hline 10 & 9 & 2 & 200 & \\ \hline 11 & 10 & 7 & 200 & \\ \hline 12 & 11 & 3 & 200 & \\ \hline 13 & 12 & 2 & 200 & \\ \hline 14 & 13 & 1 & 200 & \\ \hline 15 & Sum & 25 & 2600 & \\ \hline \end{tabular} \begin{tabular}{|l|l|} \hline Average Propotion of Retests & \\ \hline SD for a sample size of 200 & \\ \hline UCL & \\ \hline LCL & \\ \hline \end{tabular} P-chart \begin{tabular}{|r|l|l|l|} \hline & Fraction of & UCL & LCL \\ \hline 1 & & & \\ \hline 2 & & & \\ \hline 3 & & & \\ \hline 4 & & & \\ \hline 5 & & & \\ \hline 6 & & & \\ \hline 7 & & & \\ \hline 8 & & & \\ \hline 9 & & & \\ \hline 10 & & & \\ \hline 11 & & & \\ \hline 12 & & & \\ \hline 13 & & & \\ \hline & & & \\ \hline \end{tabular} Is the process in control
Step by Step Solution
There are 3 Steps involved in it

Get step-by-step solutions from verified subject matter experts