

Question: Use Excel to conduct your analysis and plot figures. Copy and paste any generated tables or figures in a word document that will be your
Use Excel to conduct your analysis and plot figures. Copy and paste any generated tables or figures in a word document that will be your assignment submission paper. Do not submit data or printouts of data, however keep the excel files in your records. Please make your assignment handout organized, clear and provide any written explanation for the numbers submitted in an easy to follow format. Create a document that reads like a report that was requested by your employer and needs to be understood by people that are not as familiar with finance theory as you are.
Question 1 (65 points)
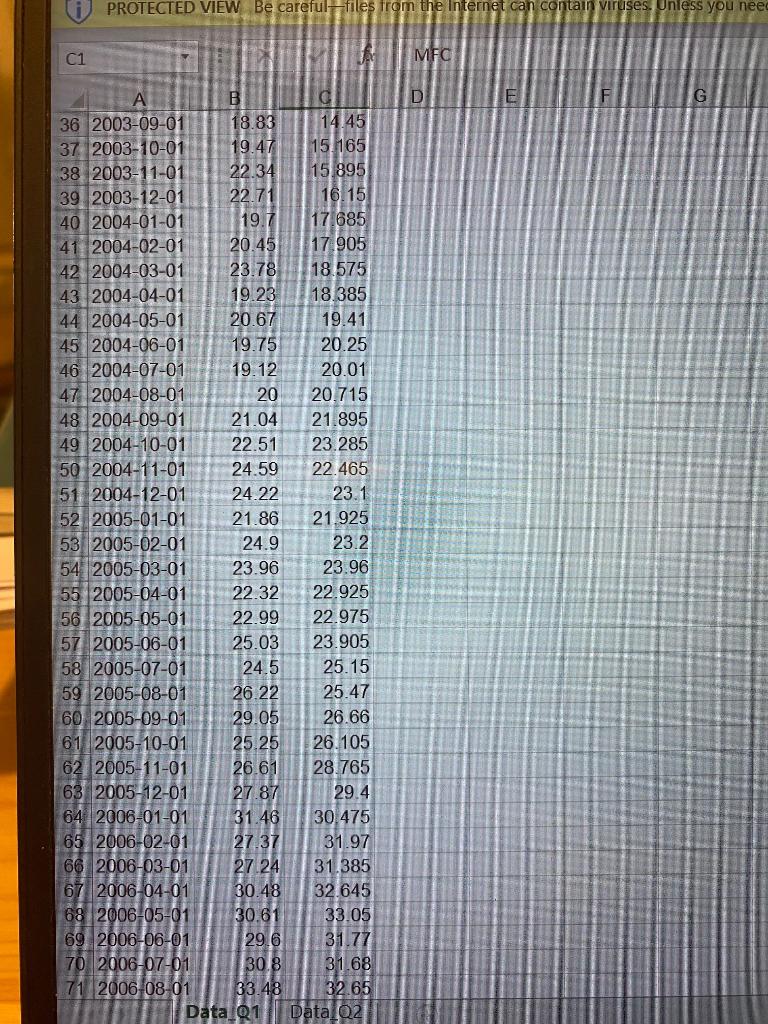
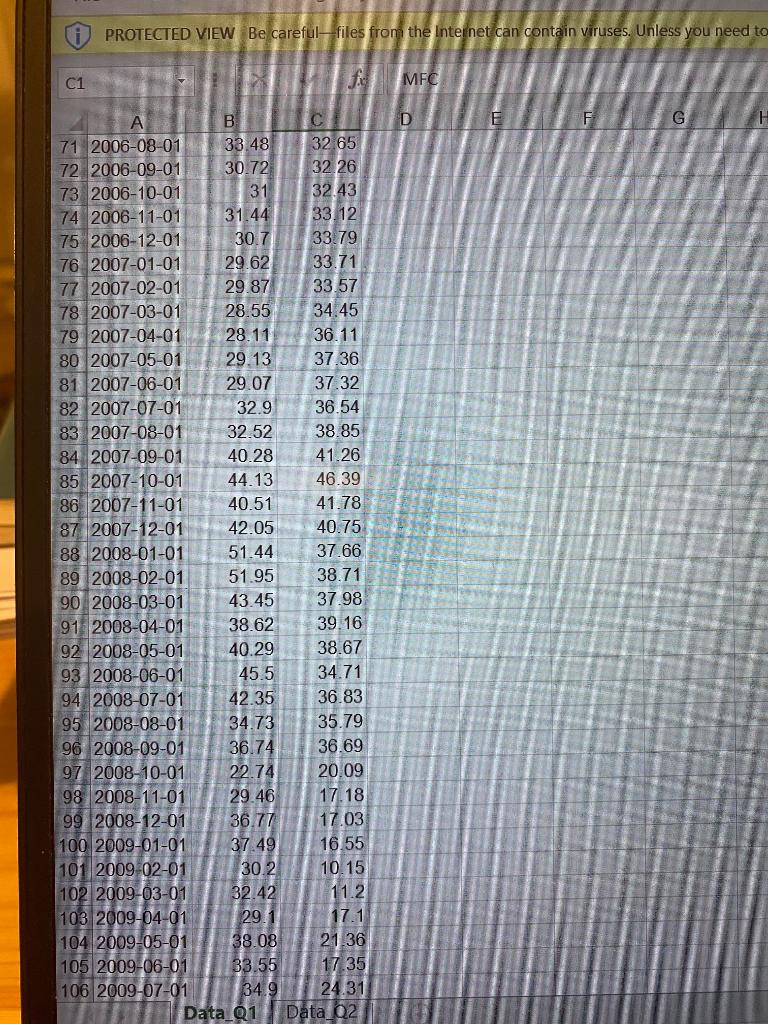
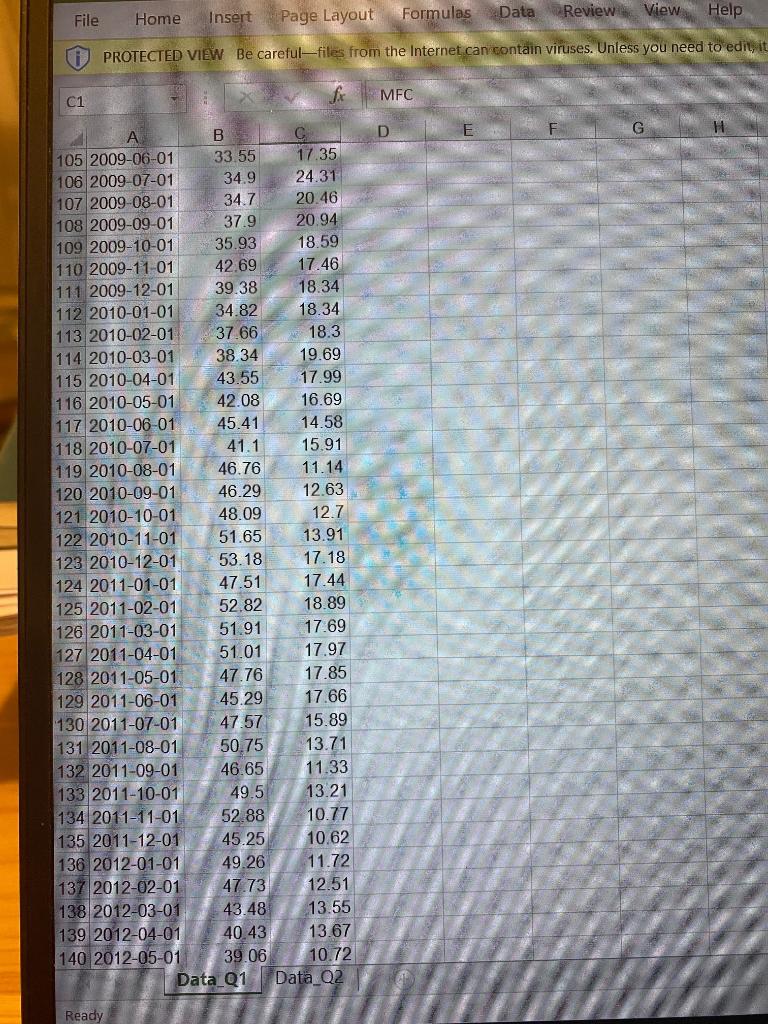
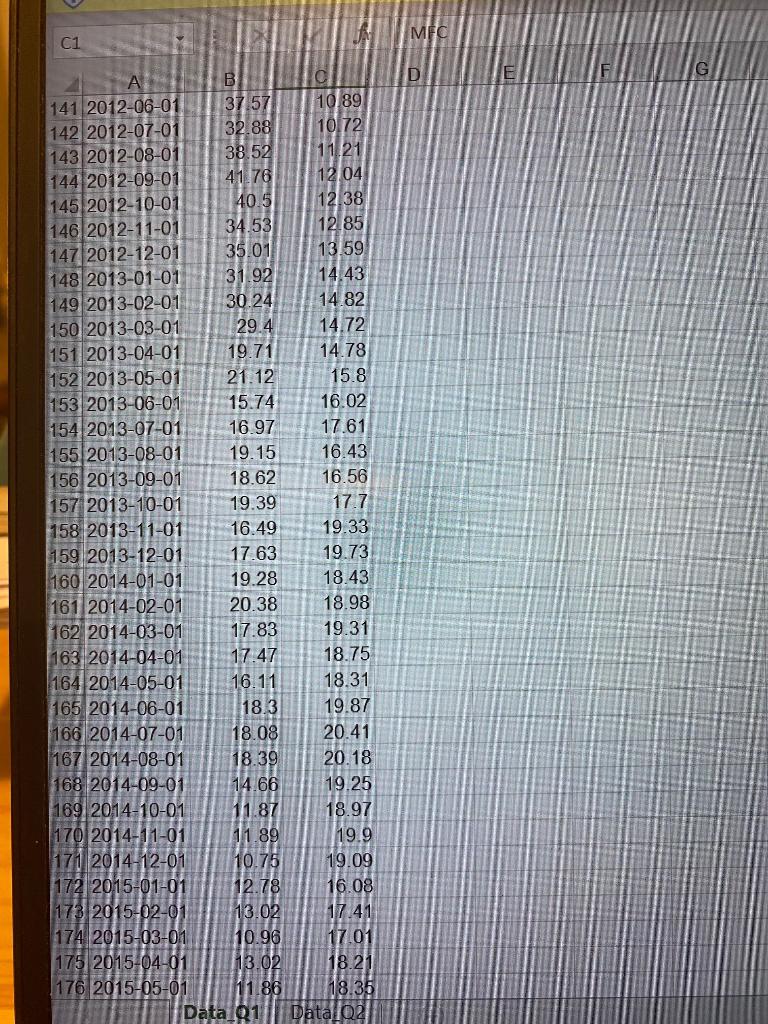
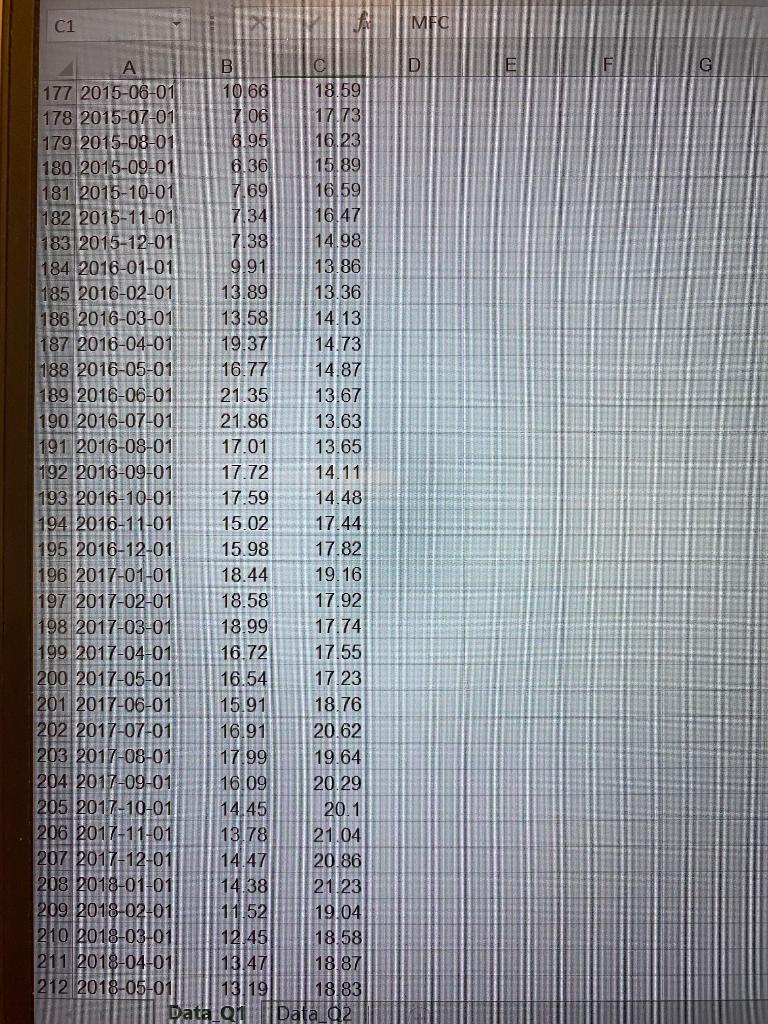
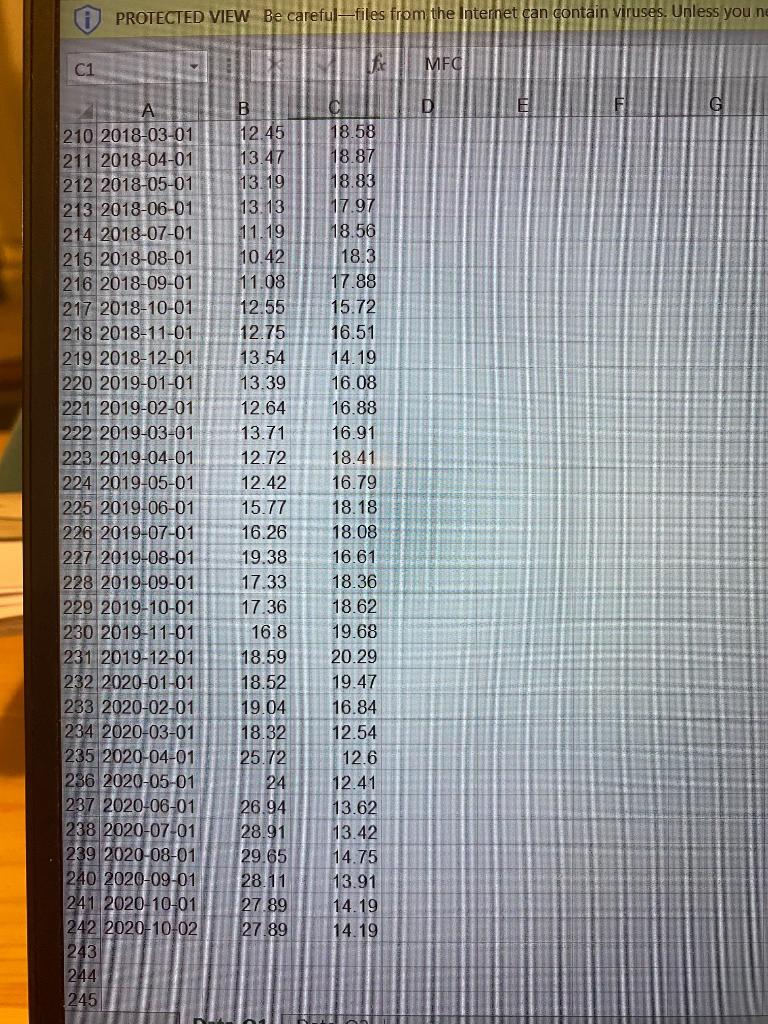
The tab Data_Q1 contains monthly close prices for Barrick Gold Corporation (GOLD) and Manulife Financial Corp (MFC) for the period November 2000 through October 2020. Assume the risk-free rate stays constant during the period of analysis and it is 1.2%.
a). Calculate monthly returns for both series of prices. Estimate the expected return, variance of GOLD and MFC and the covariance between the two return series.
We need to calculate the return first,
Return = (Current year price Previous year price)/ Previous year price
Then we need to find return data same way with MFC,
For MFC = first return = (15.6875-12.9375)/12.9375
So, 21.26%
For example, second column would be -11.71% and third column -3.75%
Now we know return from share price, afterwards we find, (P1-P0)/P0
Where P1= Current share price and P0=Previous period share price
b). Create a table that calculates expected returns and standard deviations for portfolios formed by combining the 2 stocks while changing weights in 10 percent increments (i.e. start with 100% in MFC and 0% in GOLD, then next line is 90% in MFC and 10% in GOLD, and so on, until 100% is invested in MFC and 0% in GOLD). Plot the opportunity set of risky portfolio formed by the two stocks, in excel (return, st.dev. graph), by inserting a graph in excel and selecting the right variables. Copy and paste the generated graph in the word document, as well as the table used to generate the graph.
c). What are the expected return and standard deviation of the optimal risky portfolio?
Assume you have only the 2 risky stocks to invest in and the given risk free rate. What is the Sharpe ratio? Enter the right formulas in excel and create a table with the output and copy and paste it in your word assignment document.
d). Assume an investors utility function is U = E(r) ()A2 , where A = 2
Plot utility scores while changing the weight on the optimal risky portfolio in 10 percent increment (i.e. 100% in risk-free asset, 0% in risky portfolio, 90% in risk-free and 10% in risky portfolio, and so on). Insert the excel table in your assignment.
e). Find the optimal complete portfolio for the investor with A = 2. Create a pie chart of the weights of the three assets (risk-free asset, GOLD and MFC), as resulting from your calculation, in investors optimal complete portfolio. What is the weight in the risky portfolio and what are the expected return and standard deviation of the optimal complete portfolio?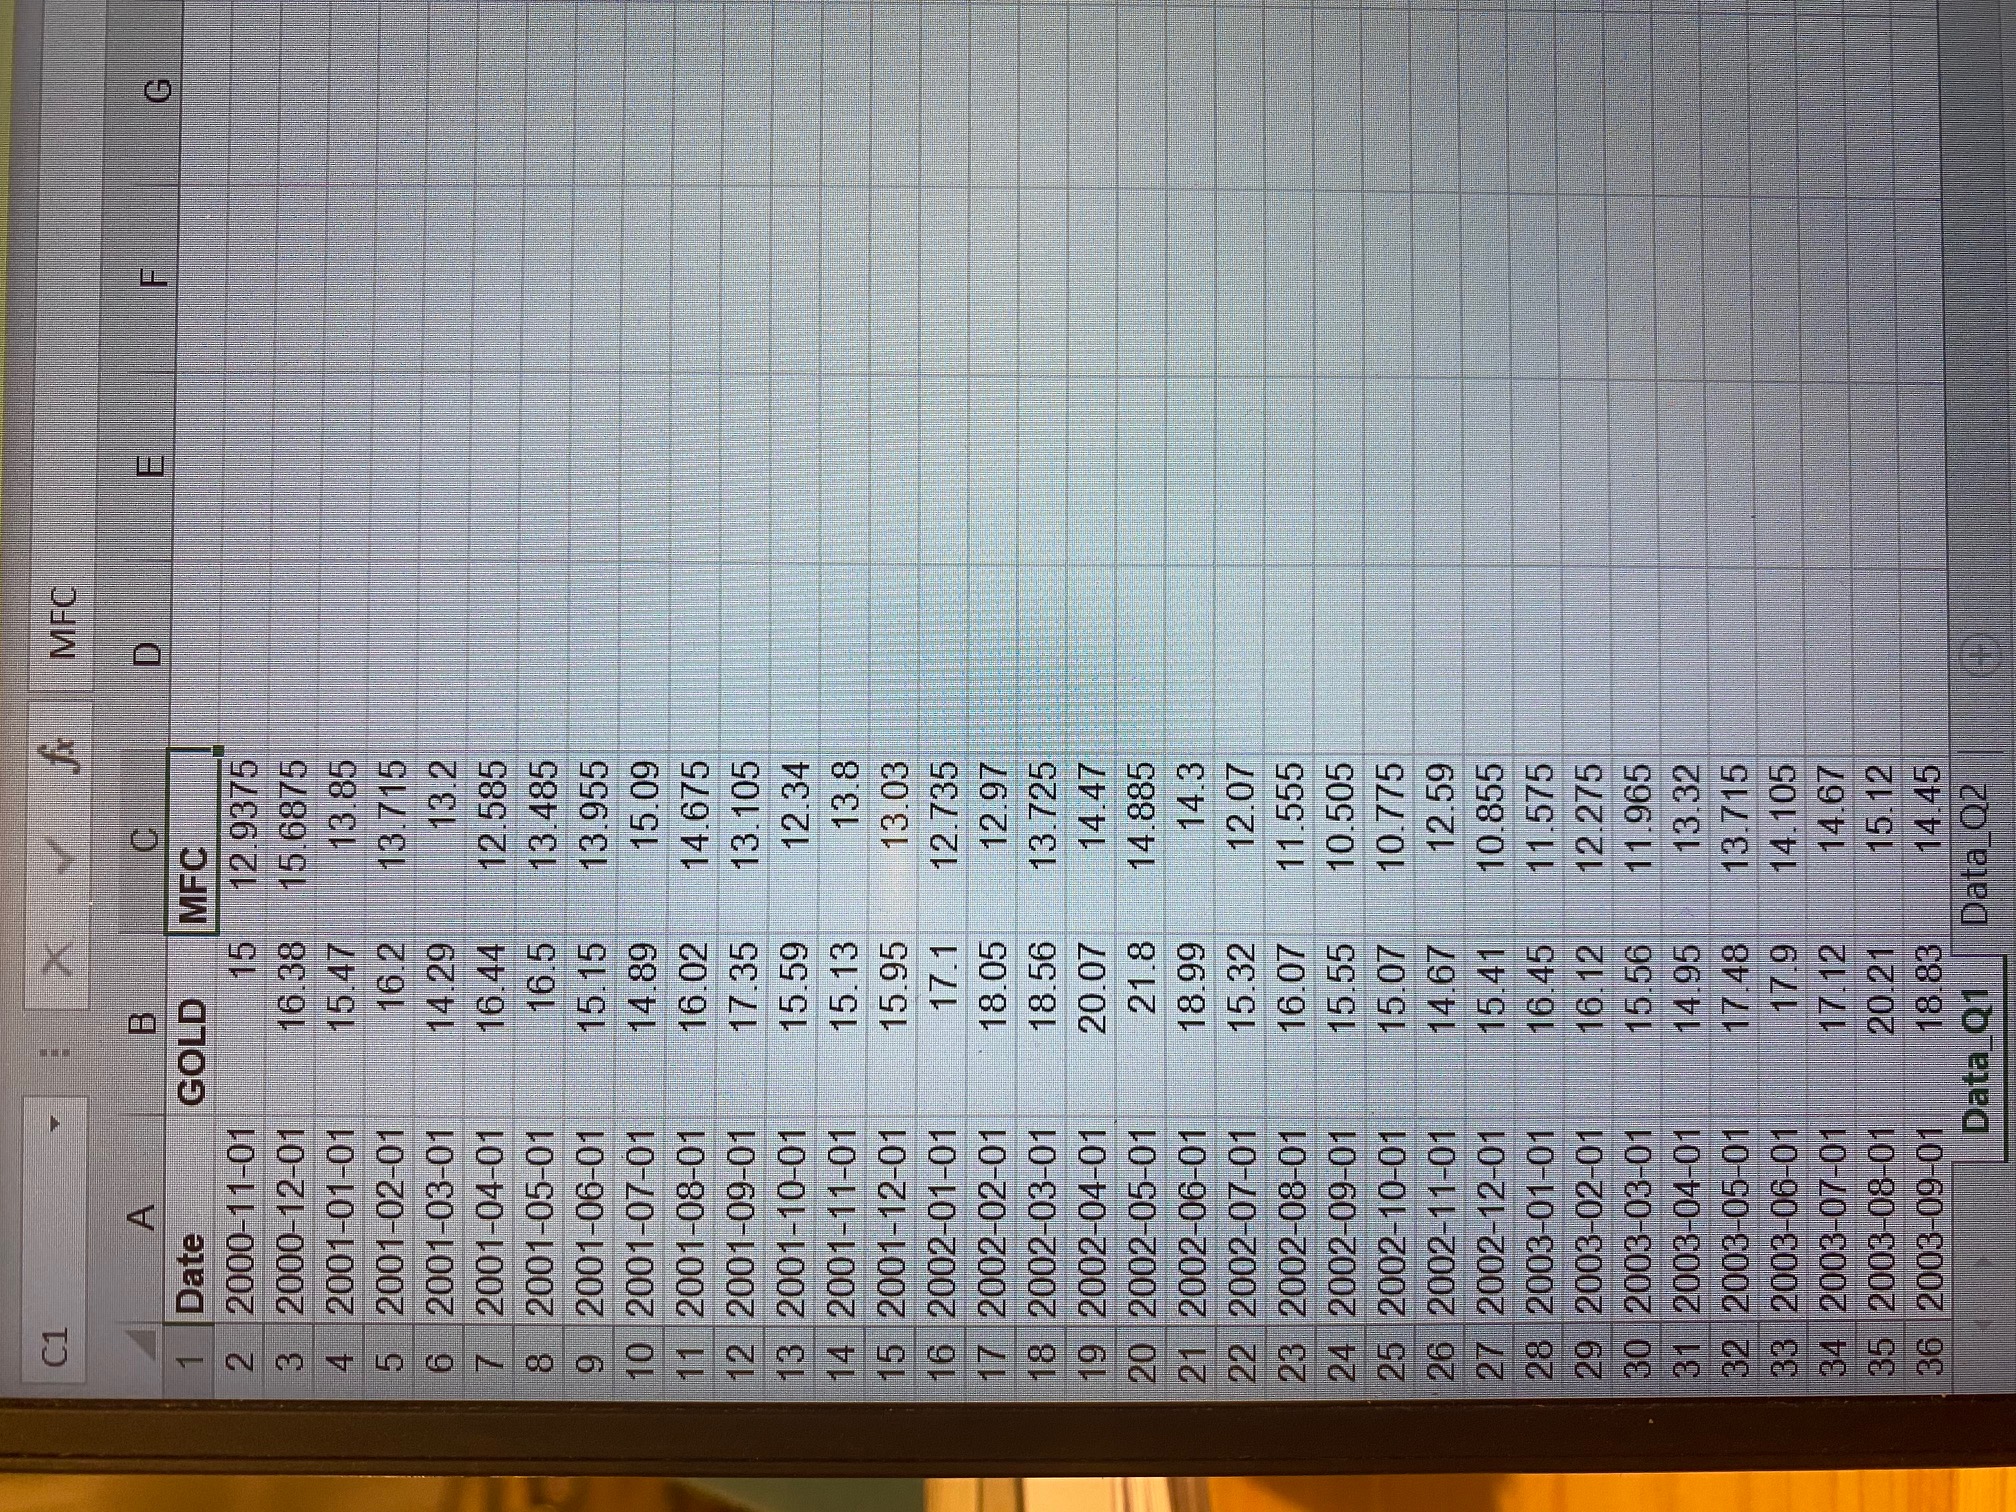
C1 X MFC D F G A B O 1 Date GOLD MFC 2 2000-11-01 15 12.9375 3 2000-12-01 16.38 15.6875 4 2001-01-01 15.47 13.85 5 2001-02-01 16.2 13.715 6 2001-03-01 14.29 13.2 7 2001-04-01 16.44 12.585 8 2001-05-01 16.5 13.485 92001-06-01 15.15 13.955 10 2001-07-01 14.89 15.09 11 2001-08-01 16.02 14.675 12 2001-09-01 17.35 13.105 13 2001-10-01 15.59 12.34 14 2001-11-01 15.13 13.8 15 2001-12-01 15.95 13.03 16 2002-01-01 17.1 12.735 17 2002-02-01 18.05 12.97 18 2002-03-01 18.56 13.725 19 2002-04-01 20.07 14.47 20 2002-05-01 21.8 14.885 21 2002-06-01 18.99 14.3 22 2002-07-01 15.32 12.07 23 2002-08-01 16.07 11.555 24 2002-09-01 15.55 10.505 25 2002-10-01 15.07 10.775 26 2002-11-01 14.67 12.59 27 2002-12-01 15.41 10.855 28 2003-01-01 16.45 11.575 29 2003-02-01 16.12 12.275 30 2003-03-01 15.56 11.965 31 2003-04-01 14.95 13.32 32 2003-05-01 17.48 13.715 33 2003-06-01 17.9 14.105 34 2003-07-01 17.12 14.67 35 2003-08-01 20.21 15.12 36 2003-09-01 18.83 14.45 Data_Q1 Data 02 PROTECTED VIEW Be careful files from the Internet can contain Viruses, unless you need C1 MFC D E E 23.2 A B 36 2003-09-01 18.83 14.45 37 2003-10-01 19.47 15.65 38 2003-11-01 22.34 15 895 39 2003-12-01 22.71 16.15 40 2004-01-01 19.7 171685 41 2004-02-01 20.45 17.905 42 2004-03-01 23.78 18.575 43 2004-04-01 19.23 18.385 44 2004-05-01 20.67 19.41 45 2004-06-01 19.75 20.25 46 2004-07-01 19.12 20.01 47 2004-08-01 20 20.715 48 2004-09-01 21.04 21.895 49 2004-10-01 22.51 23.285 50 2004-11-01 24.59 22.465 51 2004-12-01 24.22 23.1 52 2005-01-01 21.86 21.925 53 2005-02-01 24.9 54 2005-03-01 23.96 23.96 55 2005-04-01 22.32 22.925 56 2005-05-01 22.99 22.975 57 2005-06-01 25.03 23.905 58 2005-07-01 24.5 25.15 59 2005-08-01 26.22 25.47 60 2005-09-01 29.05 26.66 61 2005-10-01 25.25 26.105 62 2005-11-01 26.61 28.765 63 2005-12-01 27.87 29.4 64 2006-01-01 31.46 30.475 65 2006-02-01 27.37 31.97 66 2006-03-01 27.24 31.385 67 2006-04-01 30.48 32.645 68 2006-05-01 30.61 33.05 69 2006-06-01 29.6 31.77 70 2006-07-01 30.8 31.68 71 2006-08-01 33.48 32.65 Data 01 Data 02 PROTECTED VIEW Be careful files from the Internet can contain viruses. Unless you need to C1 MFC D E F G H 32.9 A B 71 2006-08-01 33.48 32.65 72 2006-09-01 30.72 32.26 73 2006-10-01 31 32.43 74 2006-11-01 31.44 33.12 75 2006-12-01 30.7 33.79 76 2007-01-01 29.62 33.71 77 2007-02-01 29.87 33.57 78 2007-03-01 28.55 34.45 79 2007-04-01 28.11 36.11 80 2007-05-01 29.13 37.36 81 2007-06-01 29.07 37.32 82 2007-07-01 36.54 83 2007-08-01 32.52 38.85 84 2007-09-01 40.28 41.26 85 2007-10-01 44.13 46.39 86 2007-11-01 40.51 41.78 87 2007-12-01 42.05 40.75 88 2008-01-01 51.44 37.66 89 2008-02-01 51.95 38.71 90 2008-03-01 43.45 37.98 91 2008-04-01 38.62 39.16 92 2008-05-01 40.29 38.67 93 2008-06-01 45.5 34.71 94 2008-07-01 42.35 36.83 95 2008-08-01 34.73 35.79 96 2008-09-01 36.74 36.69 97 2008-10-01 22.74 20.09 98 2008-11-01 29.46 17.18 99 2008-12-01 36.77 17.03 100 2009-01-01 37.49 16.55 101 2009-02-01 30.2 10.15 102 2009-03-01 32.42 11.2 103 2009-04-01 29.1 17.1 104 2009-05-01 38.08 21.36 105 2009-06-01 33.55 17.35 106 2009-07-01 34.9 Data_01 Data Q2 24.31 File Home Insert Page Layout Formulas Data Review View Help PROTECTED VIEW Be carefulfiles from the Internet can contain viruses. Unless you need to edit it MFC C1 D G 16.69 B C 105 2009-06-01 33.55 17.35 106 2009-07-01 34.9 24.31 107 2009-08-01 34.7 20.46 108 2009-09-01 37.9 20.94 109 2009-10-01 35.93 18.59 110 2009-11-01 42.69 17.46 111 2009-12-01 39.38 18.34 112 2010-01-01 34.82 18.34 113 2010-02-01 37.66 18.3 114 2010-03-01 38.34 19.69 115 2010-04-01 43.55 17.99 116 2010-05-01 42.08 117 2010-06-01 45.41 14.58 118 2010-07-01 41.1 15.91 119 2010-08-01 46.76 11.14 120 2010-09-01 46.29 12.63 121 2010-10-01 48.09 12.7 122 2010-11-01 51.65 13.91 123 2010-12-01 53.18 17.18 124 2011-01-01 47.51 17.44 125 2011-02-01 52.82 18.89 126 2011-03-01 51.91 17.69 127 2011-04-01 51.01 17.97 128 2011-05-01 47.76 17.85 129 2011-06-01 45.29 17.66 130 2011-07-01 47.57 15.89 131 2011-08-01 50.75 13.71 132 2011-09-01 46.65 11.33 133 2011-10-01 49.5 13.21 134 2011-11-01 52.88 10.77 135 2011-12-01 45.25 10.62 136 2012-01-01 49.26 11.72 137 2012-02-01 47.73 12.51 138 2012-03-01 43.48 13.55 139 2012-04-01 40.43 13.67 140 2012-05-01 39.06 Data 01 Data_02 10.72 Ready MEC 1 14.72 . B 141 2012-06-01 37.57 10.89 142 2012-07-01 32.88 10172 143 2012-08-01 38.52 111.21 144 2012-09-01 41.76 1204 145 2012-10-01 40.5 12.38 146 2012-11-01 34.53 12.85 147 2012-12-01 35.01 13.59 148 2013-01-01 31.92 14.43 149 2013-02-01 30.24 14.82 150 2013-03-01 29.4 151 2013-04-01 19.71 14.78 152 2013-05-01 21.12 15.8 153 2013-06-01 15.74 16.02 154 2013-07-01 16.97 17.61 155 2013-08-01 19.15 16.43 156 2013-09-01 18.62 16.56 157 2013-10-01 19.39 17.7 158 2013-11-01 16.49 19.33 159 2013-12-01 17.63 19.73 160 2014-01-01 19.28 18.43 16112014-02-01 20.38 18.98 162 2014-03-01 17.83 19.31 163 2014-04-01 17.47 18.75 164 2014-05-01 16.11 18.31 165 2014-06-01 183 19.87 166 2014-07-01 18.08 20.41 167 2014-08-01 18.39 20.18 168 2014-09-01 14.66 19.25 169 2014-10-01 11.87 18.97 170 2014-11-01 11.89 19.9 171 2014-12-01 10.75 19.09 172 2015-01-01 12.78 16.08 173 2015-02-01 13.02 17.41 174 2015-03-011 10.96 17.01 175 2015-04-01 13.02 18.21 176 2015-05-01 11.86 18.35 Data 101 Datal C1 MFC A B 177 2015-06-01 10166 178 2015-07-01 7.06 179 2015-08-01 6.95 180 2015-09-01 6.36 181 2015-10-01 7.69 182 2015-11-01 7 34 18312015-12-01 7.38 184 2016-01-01 9.91 185 2016-02-01 13.89 186 2016-03-01 13:58 187 2016-04-01 19:37 188 2016-05-01 16.77 189 2016-06-01 21.35 190 2016-07-01 21.86 191 2016-08-01 17.01 192 2016-09-01 17.72 193 2016-10-01 17.59 194 2016-11-01 15.02 195 2016-12-01 15.98 196 2017-01-01 18.44 197 2017-02-01 18.58 198 2017-03-01 18.99 199 2017-04-01 16.72 200 2017-05-01 16.54 201 2017-06-01 15.91 202 2017-07-01 16.91 20312017-08-01 17199 204 2017-09-01 16.09 205 2017-10-01 14.45 206 2017-11-01 13.78 207 2017-12-01 14.47 208 2018-01-01 14.38 209 2018-02-01 11.52 210 2018-03-01 12.45 211 2018-04-01 1347 212 2018-05-01 13 19 Data o 18.59 17.73 16.23 15189 16159 16.47 14.98 13.86 13.36 14.13 14.73 14.87 13167 13.63 13.65 14.11 14.48 17.44 17.82 19.16 17.92 17.74 17.55 17.23 18.76 20.62 19.64 20.29 20.1 21.04 20.86 2123 19/04 18 58 18.87 18/83 THE PROTECTED VIEW Be careful files from the Internet can contain viruses. Unless you ne C1 TE MFC B 12.45 113.47 13.19 13.13 11.19 10.42 11.08 A 210 2018-03-01 211 2018-04-01 212 2018-05-01 213 2018-06-01 214 2018-07-01 215 2018-08-01 216 2018-09-01 217 2018-10-01 218 2018-11-01 219 2018-12-01 220 2019-01-01 221 2019-02-01 222 2019-03-01 223 2019-04-01 224 2019-05-01 225 2019-06-01 226 2019-07-01 227 2019-08-01 228 2019-09-01 229 2019-10-01 230 2019-11-01 231 2019-12-01 232 2020-01-01 233 2020-02-01 234 2020-03-01 235 2020-04-01 236 2020-05-01 237 2020-06-01 238 2020-07-01 239 2020-08-01 240 2020-09-01 241 2020 10-01 242 2020-10-02 243 244 12.55 12.75 13.54 13.39 12.64 13.71 12.72 12.42 15.77 16.26 19.38 17.33 17.36 16.8 18.59 18.52 19.04 18.32 25.72 24 26.94 28.91 29.65 28.11 27.89 27.89 18.58 18.87 18.83 17.97 18.56 18.3 17.88 15.72 16.51 14.19 16.08 16.88 16.91 18.41 16.79 18.18 18.08 16.61 18.36 18.62 19.68 20.29 19.47 16.84 12.54 12.6 12.41 13.62 13.42 14.75 13.91 14.19 14.19 245 C1 X MFC D F G A B O 1 Date GOLD MFC 2 2000-11-01 15 12.9375 3 2000-12-01 16.38 15.6875 4 2001-01-01 15.47 13.85 5 2001-02-01 16.2 13.715 6 2001-03-01 14.29 13.2 7 2001-04-01 16.44 12.585 8 2001-05-01 16.5 13.485 92001-06-01 15.15 13.955 10 2001-07-01 14.89 15.09 11 2001-08-01 16.02 14.675 12 2001-09-01 17.35 13.105 13 2001-10-01 15.59 12.34 14 2001-11-01 15.13 13.8 15 2001-12-01 15.95 13.03 16 2002-01-01 17.1 12.735 17 2002-02-01 18.05 12.97 18 2002-03-01 18.56 13.725 19 2002-04-01 20.07 14.47 20 2002-05-01 21.8 14.885 21 2002-06-01 18.99 14.3 22 2002-07-01 15.32 12.07 23 2002-08-01 16.07 11.555 24 2002-09-01 15.55 10.505 25 2002-10-01 15.07 10.775 26 2002-11-01 14.67 12.59 27 2002-12-01 15.41 10.855 28 2003-01-01 16.45 11.575 29 2003-02-01 16.12 12.275 30 2003-03-01 15.56 11.965 31 2003-04-01 14.95 13.32 32 2003-05-01 17.48 13.715 33 2003-06-01 17.9 14.105 34 2003-07-01 17.12 14.67 35 2003-08-01 20.21 15.12 36 2003-09-01 18.83 14.45 Data_Q1 Data 02 PROTECTED VIEW Be careful files from the Internet can contain Viruses, unless you need C1 MFC D E E 23.2 A B 36 2003-09-01 18.83 14.45 37 2003-10-01 19.47 15.65 38 2003-11-01 22.34 15 895 39 2003-12-01 22.71 16.15 40 2004-01-01 19.7 171685 41 2004-02-01 20.45 17.905 42 2004-03-01 23.78 18.575 43 2004-04-01 19.23 18.385 44 2004-05-01 20.67 19.41 45 2004-06-01 19.75 20.25 46 2004-07-01 19.12 20.01 47 2004-08-01 20 20.715 48 2004-09-01 21.04 21.895 49 2004-10-01 22.51 23.285 50 2004-11-01 24.59 22.465 51 2004-12-01 24.22 23.1 52 2005-01-01 21.86 21.925 53 2005-02-01 24.9 54 2005-03-01 23.96 23.96 55 2005-04-01 22.32 22.925 56 2005-05-01 22.99 22.975 57 2005-06-01 25.03 23.905 58 2005-07-01 24.5 25.15 59 2005-08-01 26.22 25.47 60 2005-09-01 29.05 26.66 61 2005-10-01 25.25 26.105 62 2005-11-01 26.61 28.765 63 2005-12-01 27.87 29.4 64 2006-01-01 31.46 30.475 65 2006-02-01 27.37 31.97 66 2006-03-01 27.24 31.385 67 2006-04-01 30.48 32.645 68 2006-05-01 30.61 33.05 69 2006-06-01 29.6 31.77 70 2006-07-01 30.8 31.68 71 2006-08-01 33.48 32.65 Data 01 Data 02 PROTECTED VIEW Be careful files from the Internet can contain viruses. Unless you need to C1 MFC D E F G H 32.9 A B 71 2006-08-01 33.48 32.65 72 2006-09-01 30.72 32.26 73 2006-10-01 31 32.43 74 2006-11-01 31.44 33.12 75 2006-12-01 30.7 33.79 76 2007-01-01 29.62 33.71 77 2007-02-01 29.87 33.57 78 2007-03-01 28.55 34.45 79 2007-04-01 28.11 36.11 80 2007-05-01 29.13 37.36 81 2007-06-01 29.07 37.32 82 2007-07-01 36.54 83 2007-08-01 32.52 38.85 84 2007-09-01 40.28 41.26 85 2007-10-01 44.13 46.39 86 2007-11-01 40.51 41.78 87 2007-12-01 42.05 40.75 88 2008-01-01 51.44 37.66 89 2008-02-01 51.95 38.71 90 2008-03-01 43.45 37.98 91 2008-04-01 38.62 39.16 92 2008-05-01 40.29 38.67 93 2008-06-01 45.5 34.71 94 2008-07-01 42.35 36.83 95 2008-08-01 34.73 35.79 96 2008-09-01 36.74 36.69 97 2008-10-01 22.74 20.09 98 2008-11-01 29.46 17.18 99 2008-12-01 36.77 17.03 100 2009-01-01 37.49 16.55 101 2009-02-01 30.2 10.15 102 2009-03-01 32.42 11.2 103 2009-04-01 29.1 17.1 104 2009-05-01 38.08 21.36 105 2009-06-01 33.55 17.35 106 2009-07-01 34.9 Data_01 Data Q2 24.31 File Home Insert Page Layout Formulas Data Review View Help PROTECTED VIEW Be carefulfiles from the Internet can contain viruses. Unless you need to edit it MFC C1 D G 16.69 B C 105 2009-06-01 33.55 17.35 106 2009-07-01 34.9 24.31 107 2009-08-01 34.7 20.46 108 2009-09-01 37.9 20.94 109 2009-10-01 35.93 18.59 110 2009-11-01 42.69 17.46 111 2009-12-01 39.38 18.34 112 2010-01-01 34.82 18.34 113 2010-02-01 37.66 18.3 114 2010-03-01 38.34 19.69 115 2010-04-01 43.55 17.99 116 2010-05-01 42.08 117 2010-06-01 45.41 14.58 118 2010-07-01 41.1 15.91 119 2010-08-01 46.76 11.14 120 2010-09-01 46.29 12.63 121 2010-10-01 48.09 12.7 122 2010-11-01 51.65 13.91 123 2010-12-01 53.18 17.18 124 2011-01-01 47.51 17.44 125 2011-02-01 52.82 18.89 126 2011-03-01 51.91 17.69 127 2011-04-01 51.01 17.97 128 2011-05-01 47.76 17.85 129 2011-06-01 45.29 17.66 130 2011-07-01 47.57 15.89 131 2011-08-01 50.75 13.71 132 2011-09-01 46.65 11.33 133 2011-10-01 49.5 13.21 134 2011-11-01 52.88 10.77 135 2011-12-01 45.25 10.62 136 2012-01-01 49.26 11.72 137 2012-02-01 47.73 12.51 138 2012-03-01 43.48 13.55 139 2012-04-01 40.43 13.67 140 2012-05-01 39.06 Data 01 Data_02 10.72 Ready MEC 1 14.72 . B 141 2012-06-01 37.57 10.89 142 2012-07-01 32.88 10172 143 2012-08-01 38.52 111.21 144 2012-09-01 41.76 1204 145 2012-10-01 40.5 12.38 146 2012-11-01 34.53 12.85 147 2012-12-01 35.01 13.59 148 2013-01-01 31.92 14.43 149 2013-02-01 30.24 14.82 150 2013-03-01 29.4 151 2013-04-01 19.71 14.78 152 2013-05-01 21.12 15.8 153 2013-06-01 15.74 16.02 154 2013-07-01 16.97 17.61 155 2013-08-01 19.15 16.43 156 2013-09-01 18.62 16.56 157 2013-10-01 19.39 17.7 158 2013-11-01 16.49 19.33 159 2013-12-01 17.63 19.73 160 2014-01-01 19.28 18.43 16112014-02-01 20.38 18.98 162 2014-03-01 17.83 19.31 163 2014-04-01 17.47 18.75 164 2014-05-01 16.11 18.31 165 2014-06-01 183 19.87 166 2014-07-01 18.08 20.41 167 2014-08-01 18.39 20.18 168 2014-09-01 14.66 19.25 169 2014-10-01 11.87 18.97 170 2014-11-01 11.89 19.9 171 2014-12-01 10.75 19.09 172 2015-01-01 12.78 16.08 173 2015-02-01 13.02 17.41 174 2015-03-011 10.96 17.01 175 2015-04-01 13.02 18.21 176 2015-05-01 11.86 18.35 Data 101 Datal C1 MFC A B 177 2015-06-01 10166 178 2015-07-01 7.06 179 2015-08-01 6.95 180 2015-09-01 6.36 181 2015-10-01 7.69 182 2015-11-01 7 34 18312015-12-01 7.38 184 2016-01-01 9.91 185 2016-02-01 13.89 186 2016-03-01 13:58 187 2016-04-01 19:37 188 2016-05-01 16.77 189 2016-06-01 21.35 190 2016-07-01 21.86 191 2016-08-01 17.01 192 2016-09-01 17.72 193 2016-10-01 17.59 194 2016-11-01 15.02 195 2016-12-01 15.98 196 2017-01-01 18.44 197 2017-02-01 18.58 198 2017-03-01 18.99 199 2017-04-01 16.72 200 2017-05-01 16.54 201 2017-06-01 15.91 202 2017-07-01 16.91 20312017-08-01 17199 204 2017-09-01 16.09 205 2017-10-01 14.45 206 2017-11-01 13.78 207 2017-12-01 14.47 208 2018-01-01 14.38 209 2018-02-01 11.52 210 2018-03-01 12.45 211 2018-04-01 1347 212 2018-05-01 13 19 Data o 18.59 17.73 16.23 15189 16159 16.47 14.98 13.86 13.36 14.13 14.73 14.87 13167 13.63 13.65 14.11 14.48 17.44 17.82 19.16 17.92 17.74 17.55 17.23 18.76 20.62 19.64 20.29 20.1 21.04 20.86 2123 19/04 18 58 18.87 18/83 THE PROTECTED VIEW Be careful files from the Internet can contain viruses. Unless you ne C1 TE MFC B 12.45 113.47 13.19 13.13 11.19 10.42 11.08 A 210 2018-03-01 211 2018-04-01 212 2018-05-01 213 2018-06-01 214 2018-07-01 215 2018-08-01 216 2018-09-01 217 2018-10-01 218 2018-11-01 219 2018-12-01 220 2019-01-01 221 2019-02-01 222 2019-03-01 223 2019-04-01 224 2019-05-01 225 2019-06-01 226 2019-07-01 227 2019-08-01 228 2019-09-01 229 2019-10-01 230 2019-11-01 231 2019-12-01 232 2020-01-01 233 2020-02-01 234 2020-03-01 235 2020-04-01 236 2020-05-01 237 2020-06-01 238 2020-07-01 239 2020-08-01 240 2020-09-01 241 2020 10-01 242 2020-10-02 243 244 12.55 12.75 13.54 13.39 12.64 13.71 12.72 12.42 15.77 16.26 19.38 17.33 17.36 16.8 18.59 18.52 19.04 18.32 25.72 24 26.94 28.91 29.65 28.11 27.89 27.89 18.58 18.87 18.83 17.97 18.56 18.3 17.88 15.72 16.51 14.19 16.08 16.88 16.91 18.41 16.79 18.18 18.08 16.61 18.36 18.62 19.68 20.29 19.47 16.84 12.54 12.6 12.41 13.62 13.42 14.75 13.91 14.19 14.19 245
Step by Step Solution
There are 3 Steps involved in it

Get step-by-step solutions from verified subject matter experts