

Question: Use formulas provided, answer all questions correctly with a chart. The following financial statements apply to Benson Company: 2019 2018 net sales Other revenues $211,200
Use formulas provided, answer all questions correctly with a chart.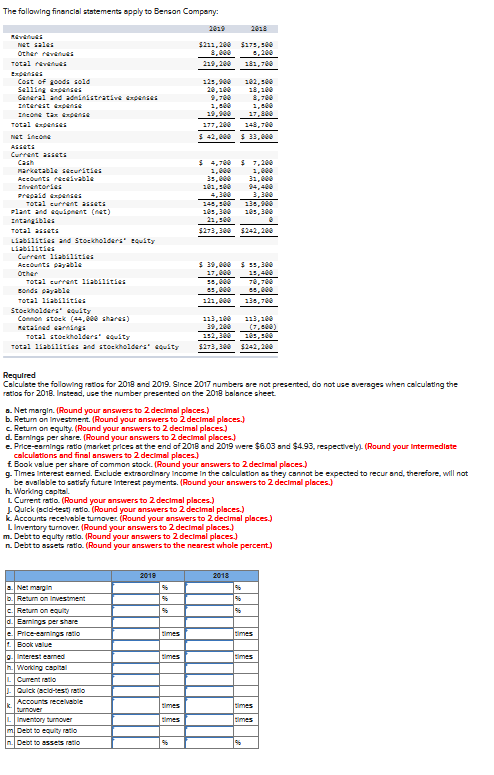
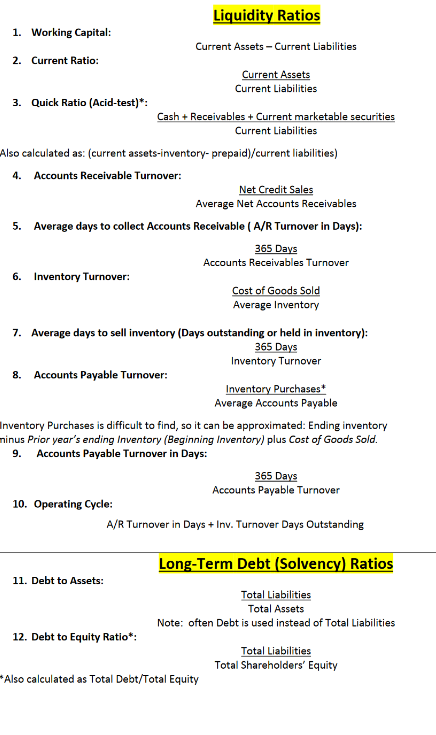
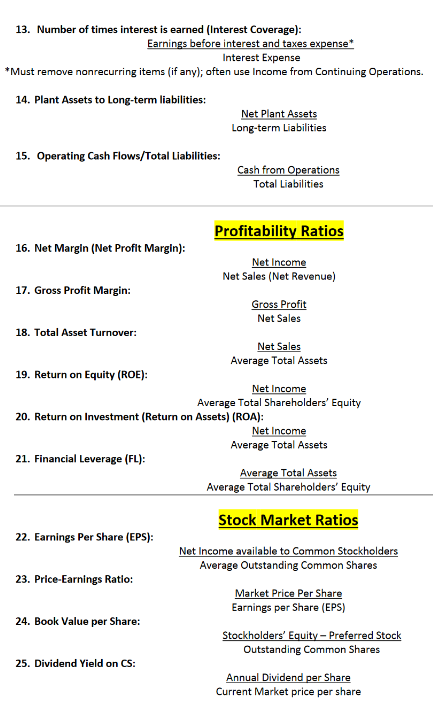
The following financial statements apply to Benson Company: 2019 2018 net sales Other revenues $211,200 $175,500 8,000 6,200 Total revenues 219,200 181,700 Cost of goods sold 121,900 102,300 Selling expenses 20,100 18,100 8,700 General and administrative expenses Interest expense 1,800 Income tax expense 19,900 17,800 Total expenses 177,200 148,700 Net Income $ 42,000 $33,000 Current asset $ 7,200 1,000 marketable securities Accounts receivable Inventories 1,000 35,000 31,000 prepaid expenses Total current assets plant and equipment (net) Intangibles 105,300 105,300 Total assets $273,300 $242,200 Liabilities and Stockholders' equity Liabilities Current Isabsisities Accounts payable $ 30,000 $ 55,300 Other 17,000 Total current liabilities 16,000 70,700 Bonds payable 45,000 15,000 Total isabilities 121,000 136,700 Stockholders equity Connon stock (44,000 shares) 113,100 matained earning 39,200 (7,500) Total stockholders' equity 152,300 105,500 Total liabilities and stockholders" equity $273,300 $242,200 Required Calculate the following ratios for 2018 and 2019. Since 2017 numbers are not presented, do not use averages when calculating the ratios for 2018. Instead, use the number presented on the 2018 balance sheet. a. Net margin. (Round your answers to 2 decimal places.) b. Return on investment. (Round your answers to 2 decimal places.) c. Return on equity. (Round your answers to 2 decimal places.) d. Earnings per share. (Round your answers to 2 decimal places.) e. Price-earnings ratio (market prices at the end of 2018 and 2019 were $6.03 and $4.93, respectively). (Round your Intermediate calculations and final answers to 2 decimal places.) Book value per share of common stock. (Round your answers to 2 decimal places.) g. Times Interest eamed. Exclude extraordinary Income in the calculation as they cannot be expected to recur and, therefore, will not be available to satisfy future Interest payments. (Round your answers to 2 decimal places.) h. Working capital. L Current ratio. (Round your answers to 2 decimal places.) J. Quick (acid-test) ratio. (Round your answers to 2 decimal places.) k Accounts receivable turnover (Round your answers to 2 decimal places.) L Inventory turnover. (Round your answers to 2 decimal places.) m. Debt to equity ratio. (Round your answers to 2 decimal places.) n. Debt to assets ratio. (Round your answers to the nearest whole percent) 2018 2018 a.Net margin b. Return on investment c. Return on equity d. Earnings per share e. Price-earnings ratio 1. Book value g. Interest earned h. Working capital L. Current ratio J.Quick (scild-test) ratio Accounts receivable turnover Inventory turnover m Debt to equity ratio n. Debt to asse's ratio times times times times 96 times times times times Liquidity Ratios Current Assets - Current Liabilities Current Assets Current Liabilities Cash + Receivables + Current marketable securities Current Liabilities 1. Working Capital: 2. Current Ratio: 3. Quick Ratio (Acid-test)*: Also calculated as: (current assets-inventory- prepaid)/current liabilities) 4. Accounts Receivable Turnover: Net Credit Sales Average Net Accounts Receivables 5. Average days to collect Accounts Receivable (A/R Turnover in Days): 365 Days Accounts Receivables Turnover 6. Inventory Turnover: Cost of Goods Sold Average Inventory 7. Average days to sell inventory (Days outstanding or held in inventory): 365 Days Inventory Turnover 8. Accounts Payable Turnover: Inventory Purchases* Average Accounts Payable Inventory Purchases is difficult to find, so it can be approximated: Ending inventory ninus Prior year's ending Inventory (Beginning Inventory) plus Cost of Goods Sold. 9. Accounts Payable Turnover in Days: 365 Days Accounts Payable Turnover 10. Operating Cycle: A/R Turnover in Days + Inv. Turnover Days Outstanding 11. Debt to Assets: 12. Debt to Equity Ratio": Also calculated as Total Debt/Total Equity Long-Term Debt (Solvency) Ratios Total Liabilities Total Assets Note: often Debt is used instead of Total Liabilities Total Liabilities Total Shareholders' Equity 13. Number of times interest is earned (Interest Coverage): Earnings before interest and taxes expense* Interest Expense *Must remove nonrecurring items (if any); often use Income from Continuing Operations. 14. Plant Assets to Long-term liabilities: Net Plant Assets Long-term Liabilities 15. Operating Cash Flows/Total Liabilities: Cash from Operations Total Liabilities Profitability Ratios 16. Net Margin (Net Profit Margin): Net Income Net Sales (Net Revenue) 17. Gross Profit Margin: Gross Profit Net Sales 18. Total Asset Turnover: Net Sales Average Total Assets 19. Return on Equity (ROE): Net Income Average Total Shareholders' Equity 20. Return on Investment (Return on Assets) (ROA): Net Income Average Total Assets 21. Financial Leverage (FL): Average Total Assets Average Total Shareholders' Equity Stock Market Ratios 22. Earnings Per Share (EPS): Net Income available to Common Stockholders Average Outstanding Common Shares 23. Price-Earnings Ratio: Market Price Per Share Earnings per Share (EPS) 24. Book Value per Share: Stockholders' Equity-Preferred Stock Outstanding Common Shares 25. Dividend Yield on CS: Annual Dividend per Share Current Market price per share
Step by Step Solution
There are 3 Steps involved in it

Get step-by-step solutions from verified subject matter experts