

Question: Use ggplot2 to generate all graphs. 3. diamonds data data(diamonds) This dataset consists of prices and quality information about 54,000 diamonds, and is included in
Use ggplot2 to generate all graphs. 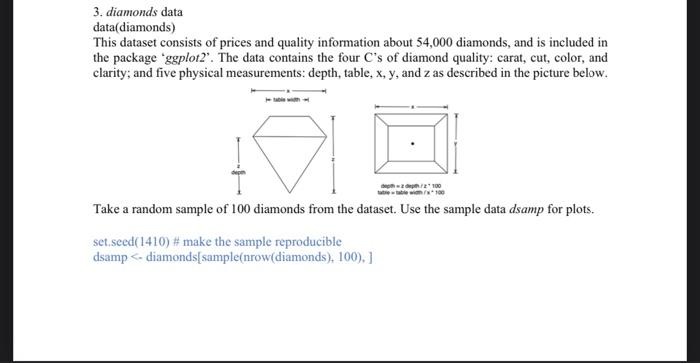
3. diamonds data data(diamonds) This dataset consists of prices and quality information about 54,000 diamonds, and is included in the package .ggplot2". The data contains the four C's of diamond quality: carat, cut, color, and clarity; and five physical measurements: depth, table, x, y, and z as described in the picture below. Take a random sample of 100 diamonds from the dataset. Use the sample data dsamp for plots. set.seed(1410) # make the sample reproducible dsamp
Step by Step Solution
There are 3 Steps involved in it
1 Expert Approved Answer
Step: 1 Unlock

Question Has Been Solved by an Expert!
Get step-by-step solutions from verified subject matter experts
Step: 2 Unlock
Step: 3 Unlock