

Question: use google sheets label axis with units Hand in a graph for a,b, and c with at least five data points over a wide range
use google sheets label axis with units 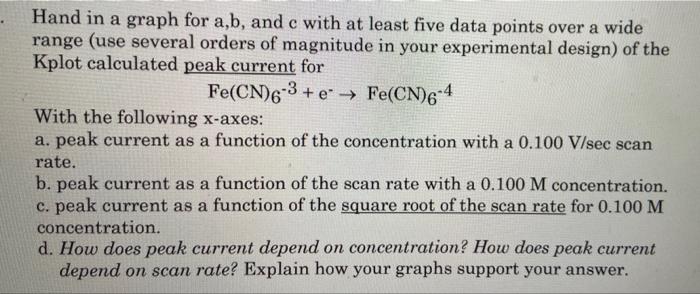
Hand in a graph for a,b, and c with at least five data points over a wide range (use several orders of magnitude in your experimental design) of the Kplot calculated peak current for Fe(CN)63 + e Fe(CN) 6-4 With the following x-axes: a. peak current as a function of the concentration with a 0.100 V/sec scan rate. b. peak current as a function of the scan rate with a 0.100 M concentration. c. peak current as a function of the square root of the scan rate for 0.100 M concentration. d. How does peak current depend on concentration? How does peak current depend on scan rate? Explain how your graphs support your
Step by Step Solution
There are 3 Steps involved in it
1 Expert Approved Answer
Step: 1 Unlock

Question Has Been Solved by an Expert!
Get step-by-step solutions from verified subject matter experts
Step: 2 Unlock
Step: 3 Unlock