

Question: Use google sheets please. Let me know if you need any additional information. K Population of Sacramento Logistic Model Fit r 500 0.05 210378 SSE
Use google sheets please. Let me know if you need any additional information.
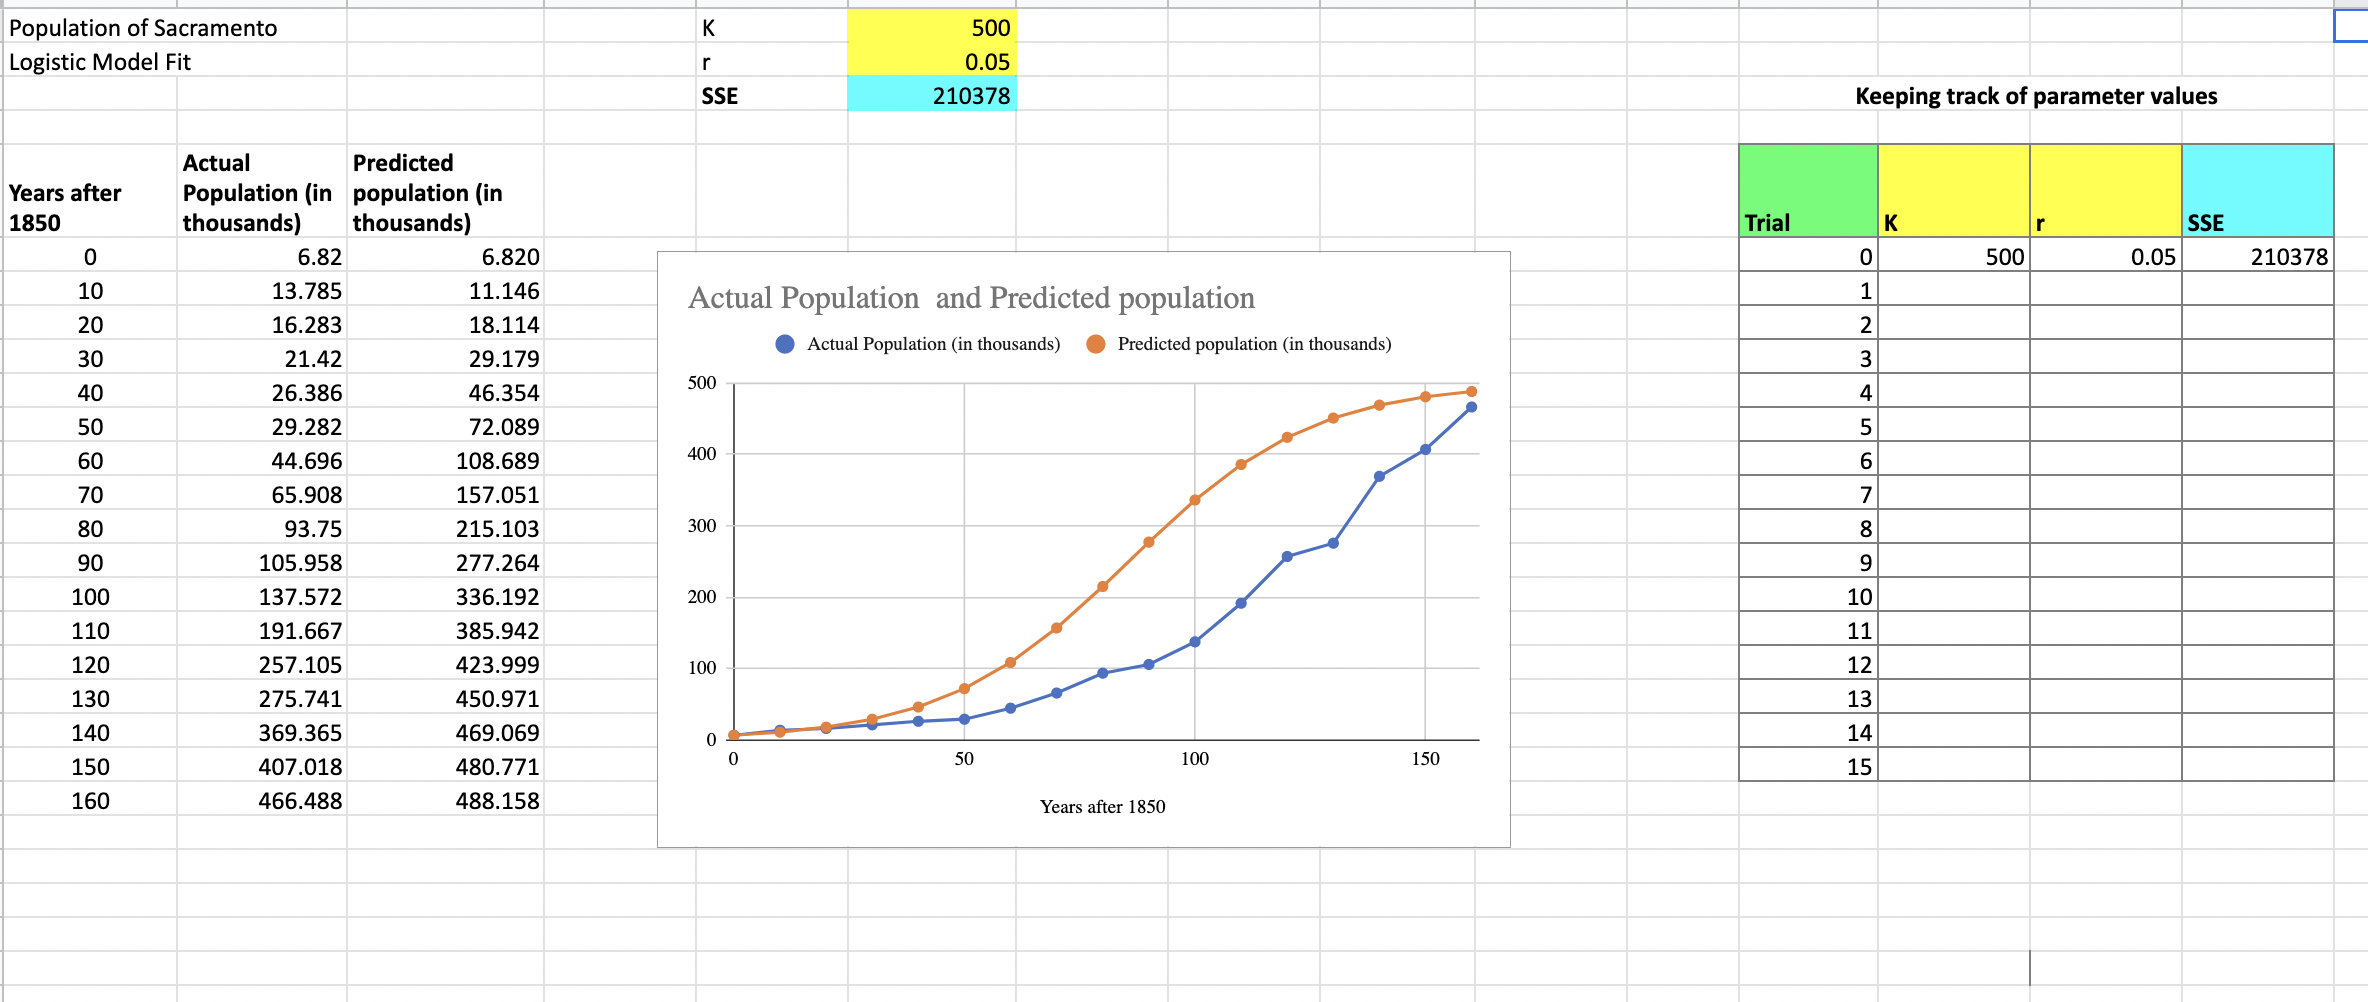
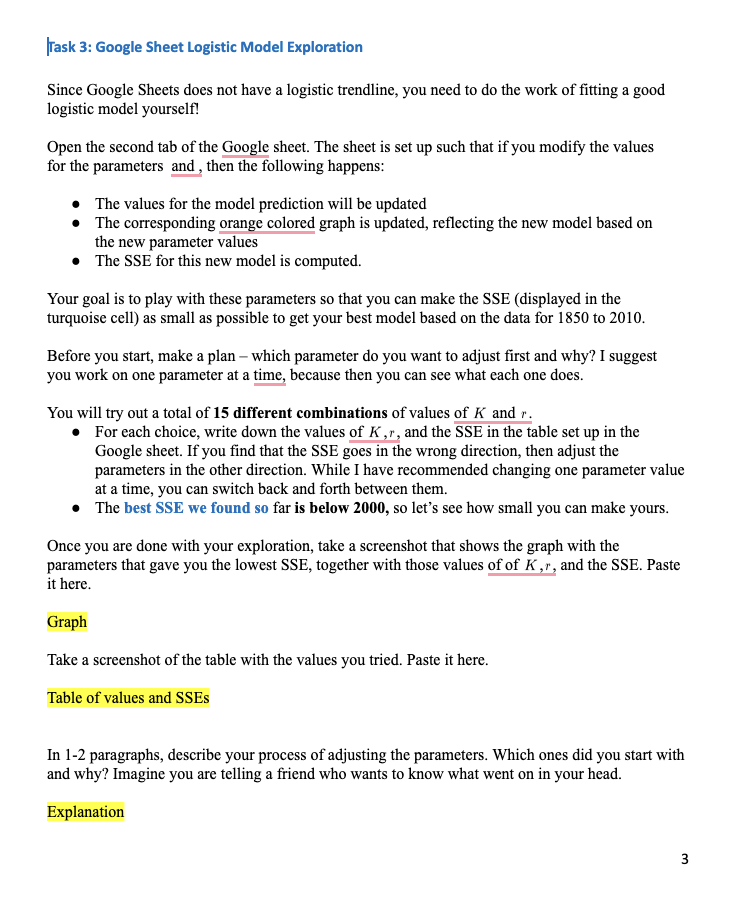
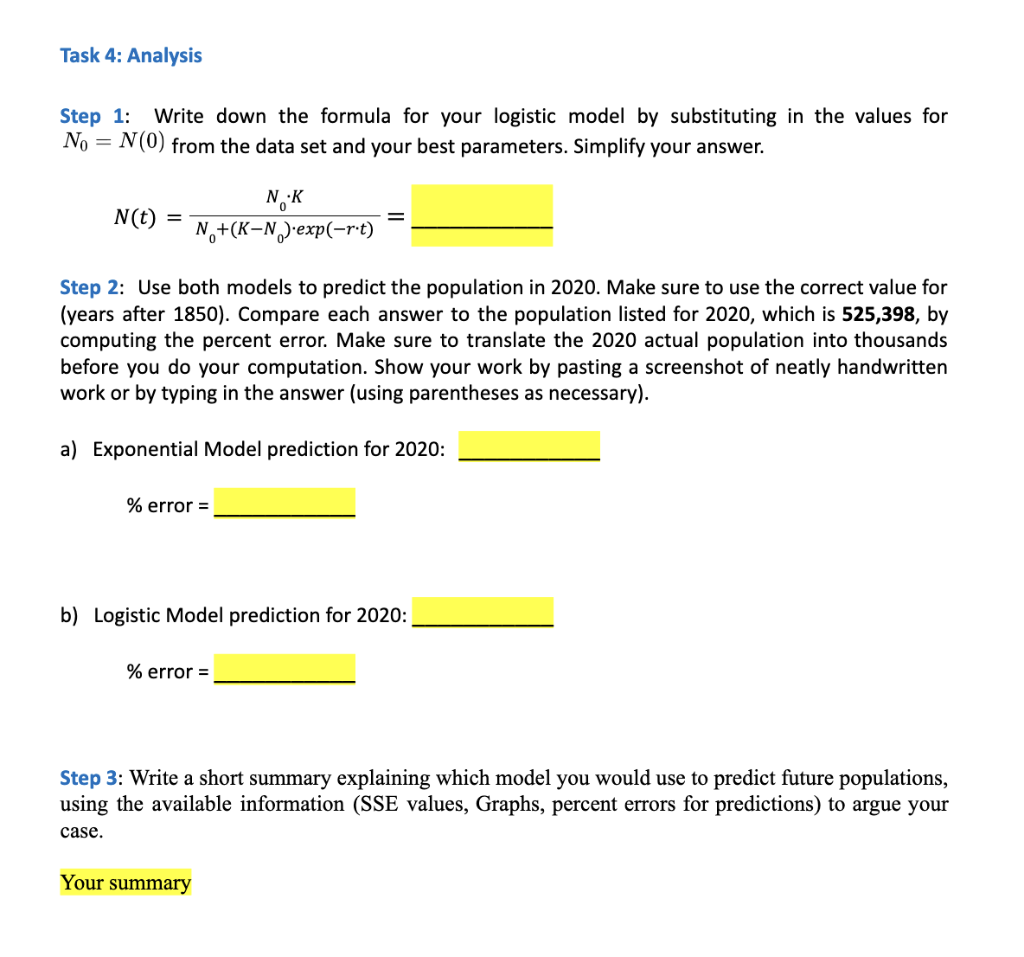
K Population of Sacramento Logistic Model Fit r 500 0.05 210378 SSE Keeping track of parameter values Trial K Years after 1850 0 10 SSE 0.05 0 500 210378 1 20 Actual Population and Predicted population Actual Population (in thousands) Predicted population (in thousands) WN 30 500 3 4 40 50 5 400 60 6 Actual Predicted Population (in population (in thousands) thousands) 6.82 6.820 13.785 11.146 16.283 18.114 21.42 29.179 26.386 46.354 29.282 72.089 44.696 108.689 65.908 157.051 93.75 215.103 105.958 277.264 137.572 336.192 191.667 385.942 257.105 423.999 275.741 450.971 369.365 469.069 407.018 480.771 466.488 488.158 70 7 80 300 8 90 100 110 9 10 200 11 100 120 130 12 13 140 14 0 0 50 100 150 150 15 160 Years after 1850 Task 3: Google Sheet Logistic Model Exploration Since Google Sheets does not have a logistic trendline, you need to do the work of fitting a good logistic model yourself! Open the second tab of the Google sheet. The sheet is set up such that if you modify the values for the parameters and then the following happens: The values for the model prediction will be updated The corresponding orange colored graph is updated, reflecting the new model based on the new parameter values The SSE for this new model is computed. Your goal is to play with these parameters so that you can make the SSE (displayed in the turquoise cell) as small as possible to get your best model based on the data for 1850 to 2010. Before you start, make a plan - which parameter do you want to adjust first and why? I suggest you work on one parameter at a time, because then you can see what each one does. You will try out a total of 15 different combinations of values of K and r. For each choice, write down the values of K ,r, and the SSE in the table set up in the Google sheet. If you find that the SSE goes in the wrong direction, then adjust the parameters in the other direction. While I have recommended changing one parameter value at a time, you can switch back and forth between them. The best SSE we found so far is below 2000, so let's see how small you can make yours. Once you are done with your exploration, take a screenshot that shows the graph with the parameters that gave you the lowest SSE, together with those values of of K,r, and the SSE. Paste it here. Graph Take a screenshot of the table with the values you tried. Paste it here. Table of values and SSES In 1-2 paragraphs, describe your process of adjusting the parameters. Which ones did you start with and why? Imagine you are telling a friend who wants to know what went on in your head. Explanation 3 3 Task 4: Analysis Step 1: Write down the formula for your logistic model by substituting in the values for No = N(0) from the data set and your best parameters. Simplify your answer. N(t) = NK N+(K-N.)-exp(-rt) Step 2: Use both models to predict the population in 2020. Make sure to use the correct value for (years after 1850). Compare each answer to the population listed for 2020, which is 525,398, by computing the percent error. Make sure to translate the 2020 actual population into thousands before you do your computation. Show your work by pasting a screenshot of neatly handwritten work or by typing in the answer (using parentheses as necessary). a) Exponential Model prediction for 2020: % error = b) Logistic Model prediction for 2020: % error = Step 3: Write a short summary explaining which model you would use to predict future populations, using the available information (SSE values, Graphs, percent errors for predictions) to argue your case. Your summary K Population of Sacramento Logistic Model Fit r 500 0.05 210378 SSE Keeping track of parameter values Trial K Years after 1850 0 10 SSE 0.05 0 500 210378 1 20 Actual Population and Predicted population Actual Population (in thousands) Predicted population (in thousands) WN 30 500 3 4 40 50 5 400 60 6 Actual Predicted Population (in population (in thousands) thousands) 6.82 6.820 13.785 11.146 16.283 18.114 21.42 29.179 26.386 46.354 29.282 72.089 44.696 108.689 65.908 157.051 93.75 215.103 105.958 277.264 137.572 336.192 191.667 385.942 257.105 423.999 275.741 450.971 369.365 469.069 407.018 480.771 466.488 488.158 70 7 80 300 8 90 100 110 9 10 200 11 100 120 130 12 13 140 14 0 0 50 100 150 150 15 160 Years after 1850 Task 3: Google Sheet Logistic Model Exploration Since Google Sheets does not have a logistic trendline, you need to do the work of fitting a good logistic model yourself! Open the second tab of the Google sheet. The sheet is set up such that if you modify the values for the parameters and then the following happens: The values for the model prediction will be updated The corresponding orange colored graph is updated, reflecting the new model based on the new parameter values The SSE for this new model is computed. Your goal is to play with these parameters so that you can make the SSE (displayed in the turquoise cell) as small as possible to get your best model based on the data for 1850 to 2010. Before you start, make a plan - which parameter do you want to adjust first and why? I suggest you work on one parameter at a time, because then you can see what each one does. You will try out a total of 15 different combinations of values of K and r. For each choice, write down the values of K ,r, and the SSE in the table set up in the Google sheet. If you find that the SSE goes in the wrong direction, then adjust the parameters in the other direction. While I have recommended changing one parameter value at a time, you can switch back and forth between them. The best SSE we found so far is below 2000, so let's see how small you can make yours. Once you are done with your exploration, take a screenshot that shows the graph with the parameters that gave you the lowest SSE, together with those values of of K,r, and the SSE. Paste it here. Graph Take a screenshot of the table with the values you tried. Paste it here. Table of values and SSES In 1-2 paragraphs, describe your process of adjusting the parameters. Which ones did you start with and why? Imagine you are telling a friend who wants to know what went on in your head. Explanation 3 3 Task 4: Analysis Step 1: Write down the formula for your logistic model by substituting in the values for No = N(0) from the data set and your best parameters. Simplify your answer. N(t) = NK N+(K-N.)-exp(-rt) Step 2: Use both models to predict the population in 2020. Make sure to use the correct value for (years after 1850). Compare each answer to the population listed for 2020, which is 525,398, by computing the percent error. Make sure to translate the 2020 actual population into thousands before you do your computation. Show your work by pasting a screenshot of neatly handwritten work or by typing in the answer (using parentheses as necessary). a) Exponential Model prediction for 2020: % error = b) Logistic Model prediction for 2020: % error = Step 3: Write a short summary explaining which model you would use to predict future populations, using the available information (SSE values, Graphs, percent errors for predictions) to argue your case. Your summary
Step by Step Solution
There are 3 Steps involved in it

Get step-by-step solutions from verified subject matter experts