

Question: Use graphical methods to construct the following (please don't write a report): (a) frequency (i.e., histogram or relative frequency) distribution graphs for all 4 variables
Use graphical methods to construct the following (please don't write a report):
(a) frequency (i.e., histogram or relative frequency) distribution graphs for all 4 variables (hint: remember to use Sturges' Formula and Excel's Data Analysis tool).
(b) a scatter diagram to explore the relationship between opening gross sales and total gross sales.
(c) a scatter diagram to explore the relationship between number of theaters and total gross sales.
(d) a scatter diagram to explore the relationship between weeks in release and total gross sales.
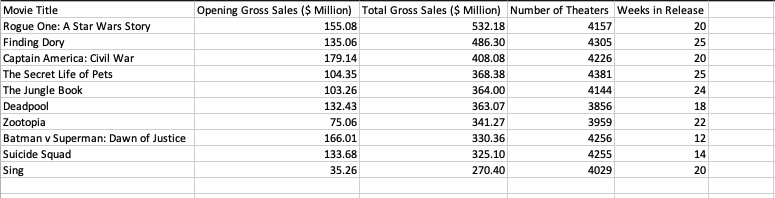
Movie Title Opening Gross Sales ($ Million) Total Gross Sales ($ Million) Number of Theaters Weeks in Release Rogue One: A Star Wars Story 155.08 532.18 4157 20 Finding Dory 135.06 486.30 4305 25 Captain America: Civil War 179.14 408.08 4226 20 The Secret Life of Pets 104.35 368.38 4381 25 The Jungle Book 103.26 364.00 4144 24 Deadpool 132.43 363.07 3856 18 Zootopia 75.06 341.27 3959 22 Batman v Superman: Dawn of Justice 166.01 330.36 4256 12 Suicide Squad 133.68 325.10 4255 14 Sing 35.26 270.40 4029 20
Step by Step Solution
There are 3 Steps involved in it

Get step-by-step solutions from verified subject matter experts