

Question: Use Home Depots financial information in Appendix A. a. Compute ROI and EVA for the two most recent years reported. Use Net Earnings as a
 Use Home Depots financial information in Appendix A. a. Compute ROI and EVA for the two most recent years reported. Use Net Earnings as a measure of earnings or returns, and Net Property and Equipment as the invested capital base. Assume the weighted-average cost of capital is 10 percent. b. Are they improving or declining?
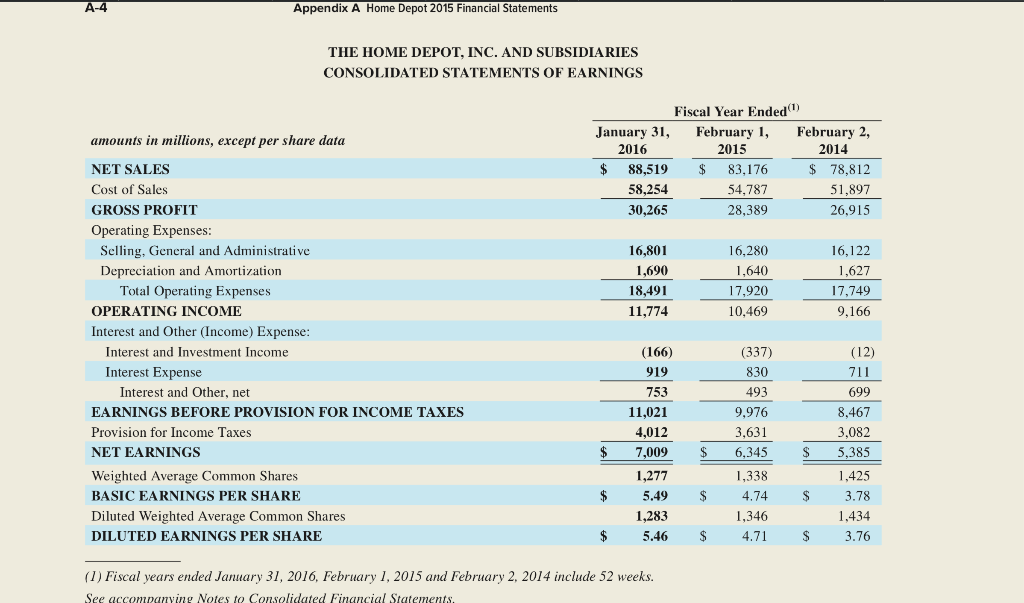
A4 Appendix A Home Depot 2015 Financial Statements THE HOME DEPOT, INC. AND SUBSIDIARIES CONSOLIDATED STATEMENTS OF EARNINGS Fiscal Year Ended (1) January 31, February 1, February 2, 2016 2015 2014 $ 88,519 $ 83,176 $ 78,812 58,254 54,787 51,897 30,265 28,389 26,915 16,801 1,690 18,491 11,774 16,280 1,640 17,920 10,469 16,122 1,627 17,749 9,166 amounts in millions, except per share data NET SALES Cost of Sales GROSS PROFIT Operating Expenses: Selling, General and Administrative Depreciation and Amortization Total Operating Expenses OPERATING INCOME Interest and Other (Income) Expense: Interest and Investment Income Interest Expense Interest and Other, net EARNINGS BEFORE PROVISION FOR INCOME TAXES Provision for Income Taxes NET EARNINGS Weighted Average Common Shares BASIC EARNINGS PER SHARE Diluted Weighted Average Common Shares DILUTED EARNINGS PER SHARE (166) 919 753 11.021 (337) 830 493 9,976 3,631 6,345 1,338 4.74 1,346 4.71 $ $ 4,012 7,009 1,277 5.49 1,283 5.46 $ (12) 711 699 8,467 3,082 5,385 1,425 3.78 1,434 3.76 $ $ $ $ $ $ (1) Fiscal years ended January 31, 2016, February 1, 2015 and February 2, 2014 include 52 weeks. See accompanying Notes to Consolidated Financial Statements. A4 Appendix A Home Depot 2015 Financial Statements THE HOME DEPOT, INC. AND SUBSIDIARIES CONSOLIDATED STATEMENTS OF EARNINGS Fiscal Year Ended (1) January 31, February 1, February 2, 2016 2015 2014 $ 88,519 $ 83,176 $ 78,812 58,254 54,787 51,897 30,265 28,389 26,915 16,801 1,690 18,491 11,774 16,280 1,640 17,920 10,469 16,122 1,627 17,749 9,166 amounts in millions, except per share data NET SALES Cost of Sales GROSS PROFIT Operating Expenses: Selling, General and Administrative Depreciation and Amortization Total Operating Expenses OPERATING INCOME Interest and Other (Income) Expense: Interest and Investment Income Interest Expense Interest and Other, net EARNINGS BEFORE PROVISION FOR INCOME TAXES Provision for Income Taxes NET EARNINGS Weighted Average Common Shares BASIC EARNINGS PER SHARE Diluted Weighted Average Common Shares DILUTED EARNINGS PER SHARE (166) 919 753 11.021 (337) 830 493 9,976 3,631 6,345 1,338 4.74 1,346 4.71 $ $ 4,012 7,009 1,277 5.49 1,283 5.46 $ (12) 711 699 8,467 3,082 5,385 1,425 3.78 1,434 3.76 $ $ $ $ $ $ (1) Fiscal years ended January 31, 2016, February 1, 2015 and February 2, 2014 include 52 weeks. See accompanying Notes to Consolidated Financial Statements
Step by Step Solution
There are 3 Steps involved in it

Get step-by-step solutions from verified subject matter experts