

Question: Use horizontal analysis to analyze trends in financial statement data, such as the amount of change and the percentage change, for one company over time.
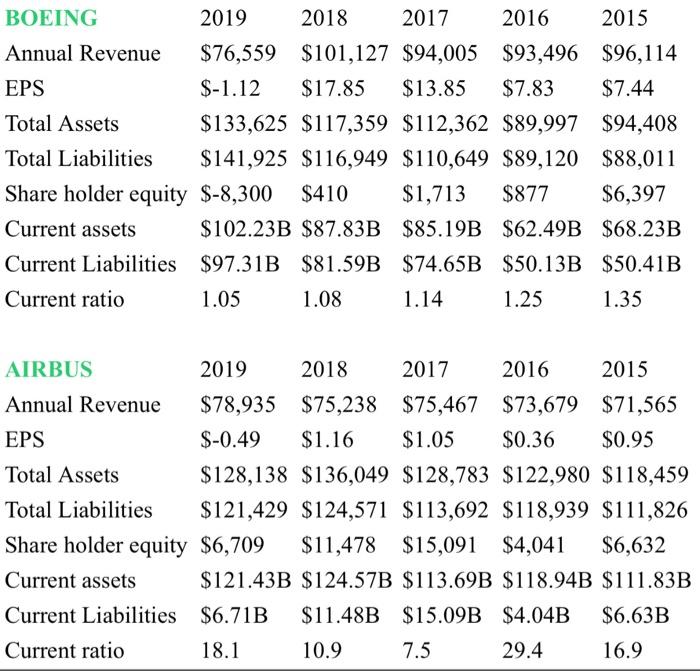
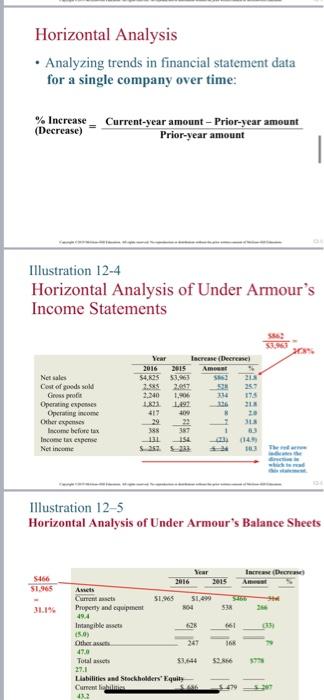
BOEING 2019 2018 2017 2016 2015 Annual Revenue $76,559 $101,127 $94,005 $93,496 $96,114 EPS $-1.12 $17.85 $13.85 $7.83 $7.44 Total Assets $133,625 $117,359 $112,362 $89,997 $94,408 Total Liabilities $141,925 $116,949 $110,649 $89,120 $88,011 Share holder equity $-8,300 $410 $1,713 $877 $6,397 Current assets $102.23B $87.83B $85.19B $62.49B $68.23B Current Liabilities $97.31B $81.59B $74.65B $50.13B $50.41B Current ratio 1.05 1.08 1.14 1.25 1.35 AIRBUS 2019 2018 2017 2016 2015 Annual Revenue $78,935 $75,238 $75,467 $73,679 $71,565 EPS $-0.49 $1.16 $1.05 $0.36 $0.95 Total Assets $128,138 $136,049 $128,783 $122,980 $118,459 Total Liabilities $121,429 $124,571 $113,692 $118,939 $111,826 Share holder equity $6,709 $11,478 $15,091 $4,041 $6,632 Current assets $121.43B $124.57B $113.69B $118.94B $111.83B Current Liabilities $6.71B $11.48B $15.09B $4.04B $6.63B Current ratio 18.1 10.9 7.5 29.4 16.9 Horizontal Analysis Analyzing trends in financial statement data for a single company over time: % Increase (Decrease) Current-year amount - Prior-year amount Prior-year amount Illustration 12-4 Horizontal Analysis of Under Armour's Income Statements Net sales Cost of goods sold Gross Operating expetes Operating income Other expenses Income before tax Income tax expense Net income SER 20 Increase (Deere 2016 2015 Amen 54.25 5.43 2. 25. 2,340 1. 10 17 1.191 126 400 29 22 387 1 154 (14) 13 Illustration 12-5 Horizontal Analysis of Under Armour's Balance Sheets 5466 Intres (Dras 2016 51.5 51.49 53 Anet Current Property and equipment 494 Intangible asset 15.0 Other 47.0 Total 661 105 Liabilities and stockholders' Equity Cment in 132 $_479
Step by Step Solution
There are 3 Steps involved in it

Get step-by-step solutions from verified subject matter experts