

Question: Use INDEX and MATCH functions to fill in a table that extracts the amounts shipped between each pair of cities in the accompanying data,
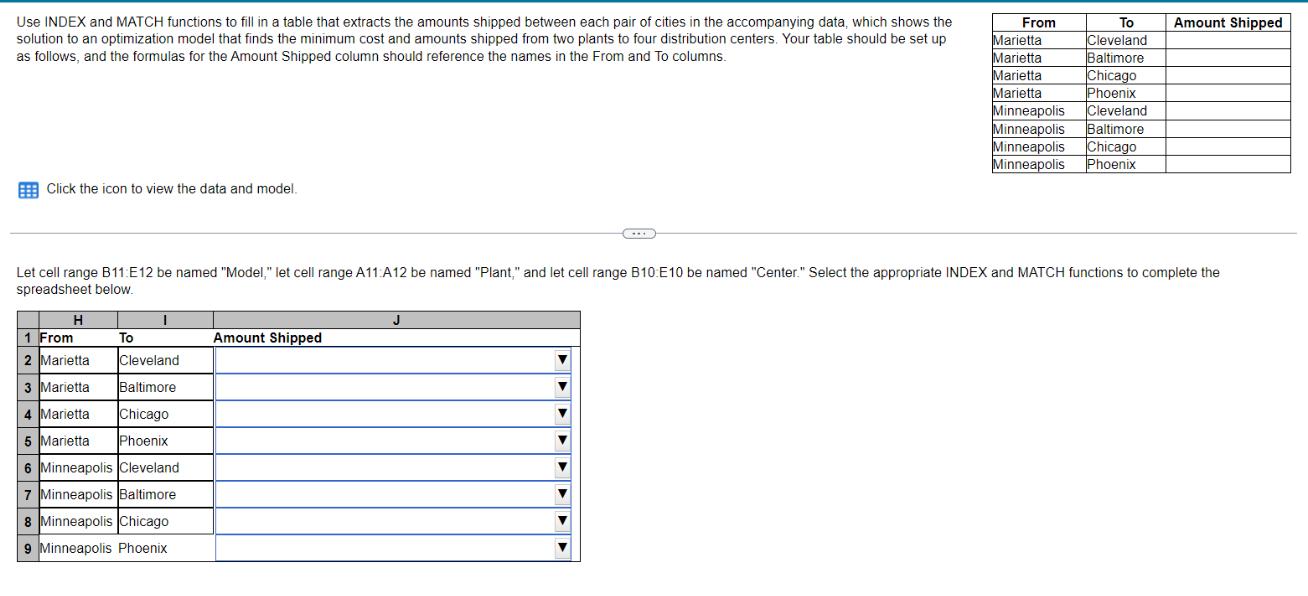
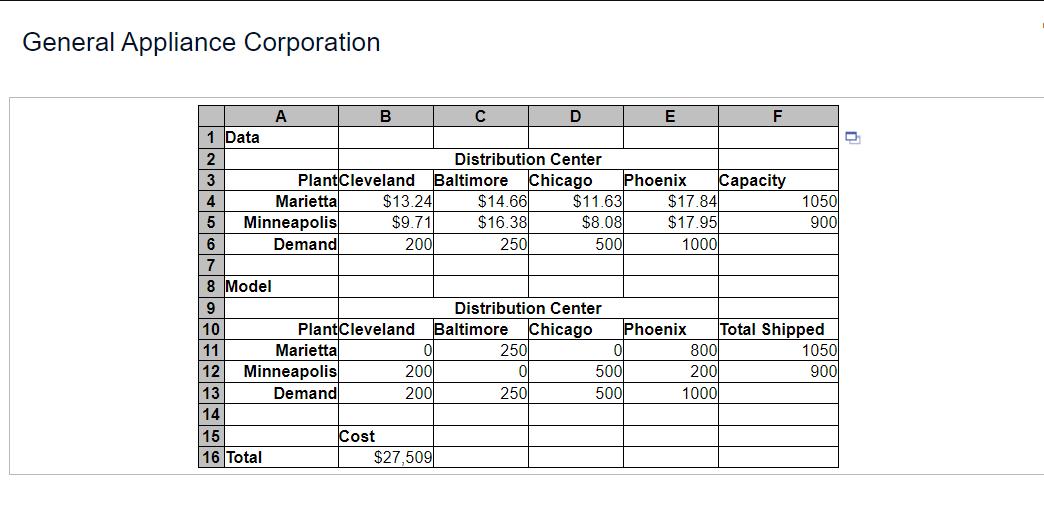
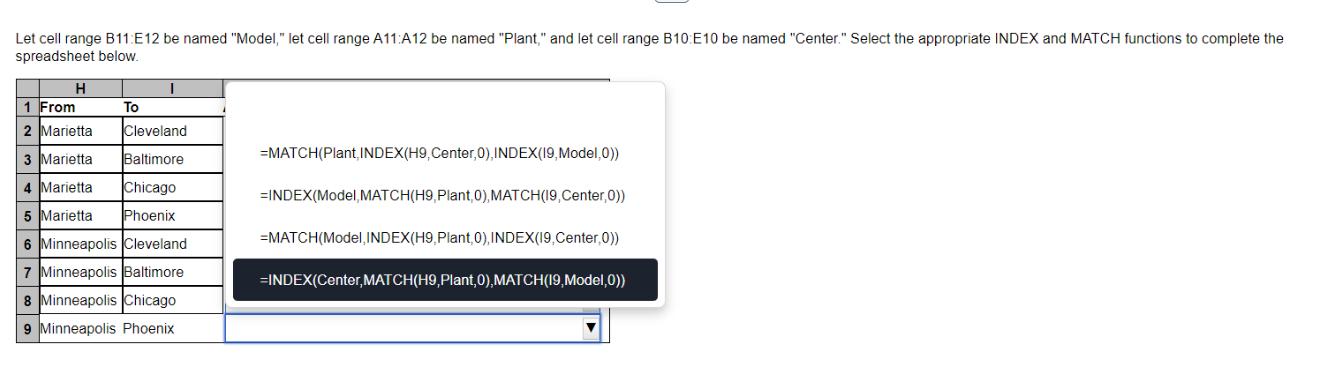
Use INDEX and MATCH functions to fill in a table that extracts the amounts shipped between each pair of cities in the accompanying data, which shows the solution to an optimization model that finds the minimum cost and amounts shipped from two plants to four distribution centers. Your table should be set up as follows, and the formulas for the Amount Shipped column should reference the names in the From and To columns. Click the icon to view the data and model. H 1 From 2 Marietta Cleveland 3 Marietta Baltimore 4 Marietta Chicago 5 Marietta Phoenix 6 Minneapolis Cleveland 7 Minneapolis Baltimore 8 Minneapolis Chicago 9 Minneapolis Phoenix 1 To Let cell range B11 E12 be named "Model," let cell range A11 A12 be named "Plant," and let cell range B10:E10 be named "Center." Select the appropriate INDEX and MATCH functions to complete the spreadsheet below. Amount Shipped From J To Amount Shipped Marietta Marietta Marietta Marietta Cleveland Baltimore Chicago Phoenix Minneapolis Cleveland Minneapolis Baltimore Minneapolis Chicago Phoenix Minneapolis General Appliance Corporation 1 Data 2 3 4 5 6 7 8 Model 9 10 11 12 13 14 A 15 16 Total Plant Cleveland Marietta Minneapolis Demand Marietta Minneapolis Demand B Plant Cleveland Cost $13.24 $9.71 200 $27,509 C 0 200 200 Distribution Center Baltimore Chicago $14.66 $16.38 250 D Distribution Center Baltimore Chicago 250 0 250 $11.63 $8.08 500 E Phoenix 0 500 500 $17.84 $17.95 1000 F Capacity Phoenix Total Shipped 1050 900 800 200 1000 1050 900 Let cell range B11:E12 be named "Model," let cell range A11:A12 be named "Plant," and let cell range B10: E10 be named "Center." Select the appropriate INDEX and MATCH functions to complete the spreadsheet below. H I To 1 From 2 Marietta 3 Marietta Cleveland Baltimore 4 Marietta Chicago 5 Marietta Phoenix 6 Minneapolis Cleveland 7 Minneapolis Baltimore 8 Minneapolis Chicago 9 Minneapolis Phoenix =MATCH(Plant INDEX(H9, Center, 0), INDEX(19, Model,0)) =INDEX(Model, MATCH(H9, Plant,0), MATCH(19, Center, 0)) =MATCH(Model, INDEX(H9, Plant,0), INDEX(19,Center, 0)) =INDEX(Center, MATCH(H9, Plant,0), MATCH(19, Model,0))
Step by Step Solution
3.59 Rating (152 Votes )
There are 3 Steps involved in it
Based on the named ranges Model for B11E12 Plant for A11A12 and Center for B10E10 the correct formul... View full answer

Get step-by-step solutions from verified subject matter experts