

Question: use matlab and screenshot the code pls this information is all for number 3 3. Peng-Robinson (PR) equation of state is given by RT a(T)
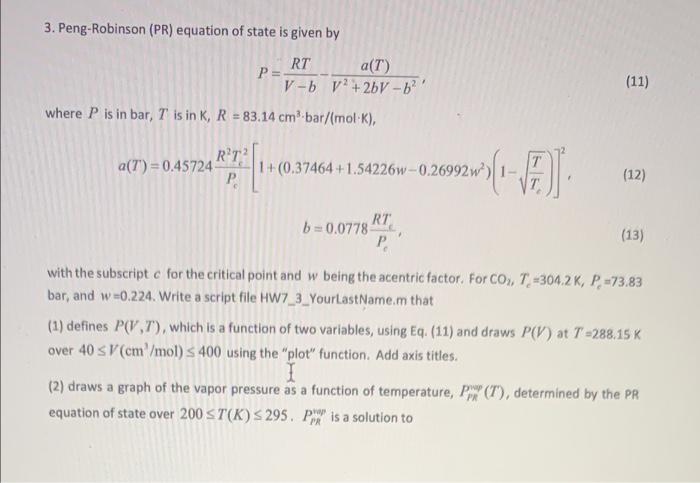
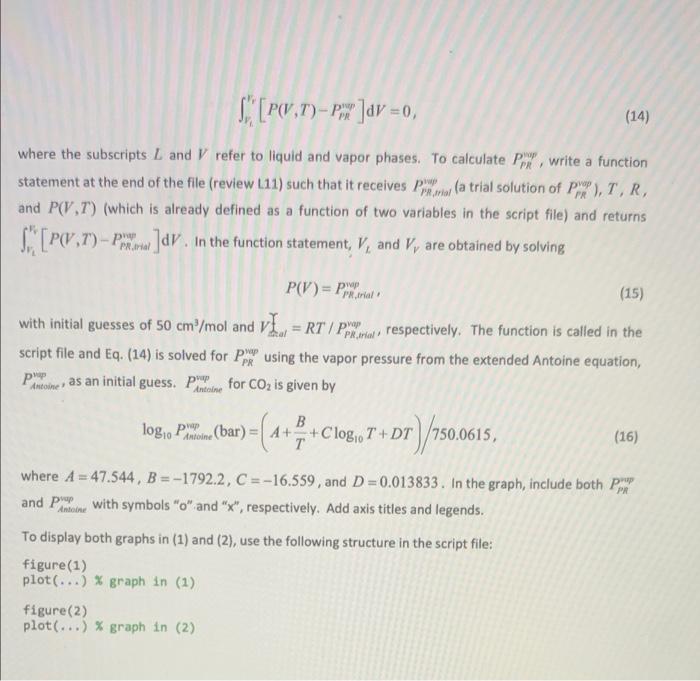
3. Peng-Robinson (PR) equation of state is given by RT a(T) P= V-b v? +2bV - 62! where P is in bar, T is in K, R = 83.14 cm-bar/(mol-K), (11) RY a(7") = 0.45724 . 1+(0.37464 +1.54226w-0.26992w) 1 2014 ) (12) RT b=0.0778 . (13) with the subscript c for the critical point and w being the acentric factor. For CO., 7.-3042 K, P =73.83 bar, and w=0.224. Write a script file HW7_3_YourLastName.m that (1) defines P( VT), which is a function of two variables, using Eq. (11) and draws P(V) at T=288,15 K over 40 SV (cm /mol) S 400 using the "plot" function. Add axis titles. 1 (2) draws a graph of the vapor pressure as a function of temperature, P (T), determined by the PR equation of state over 200 ST(K) 295. Pintu is a solution to PR [PW.T)-px]av = 0, (14) where the subscripts L and V refer to liquid and vapor phases. To calculate Ppx", write a function statement at the end of the file (review (11) such that it receives Ppxwar (a trial solution of P, T, R, and P(V.7") (which is already defined as a function of two variables in the script file) and returns [P(,1) - Par. In the function statement, V, and V, are obtained by solving P.trial PR trial P(V) = par (15) with initial guesses of 50 cm/mol and VI. = RT / polos a respectively. The function is called in the script file and Eq. (14) is solved for pre using the vapor pressure from the extended Antoine equation, PP as an initial guess. Per for CO2 is given by PR Antoine Antoine B logo Phine (bar) = A ++Clogo? "log,0T+DT T )/1500615 , (16) where A = 47.544, B = -1792.2, C =-16.559, and D=0.013833. In the graph, include both Ppt and Pure with symbols "o" and "x", respectively. Add axis titles and legends. To display both graphs in (1) and (2), use the following structure in the script file: figure(1) plot(...) % graph in (1) figure(2) plot(...) % graph in (2)
Step by Step Solution
There are 3 Steps involved in it

Get step-by-step solutions from verified subject matter experts