

Question: Use MATLAB, answer questions 1-3 and include plots. Read instructions and include everything that is needed in answers ex. (matlab code, plots, etc.) Introduction The
Use MATLAB, answer questions 1-3 and include plots. Read instructions and include everything that is needed in answers ex. (matlab code, plots, etc.)
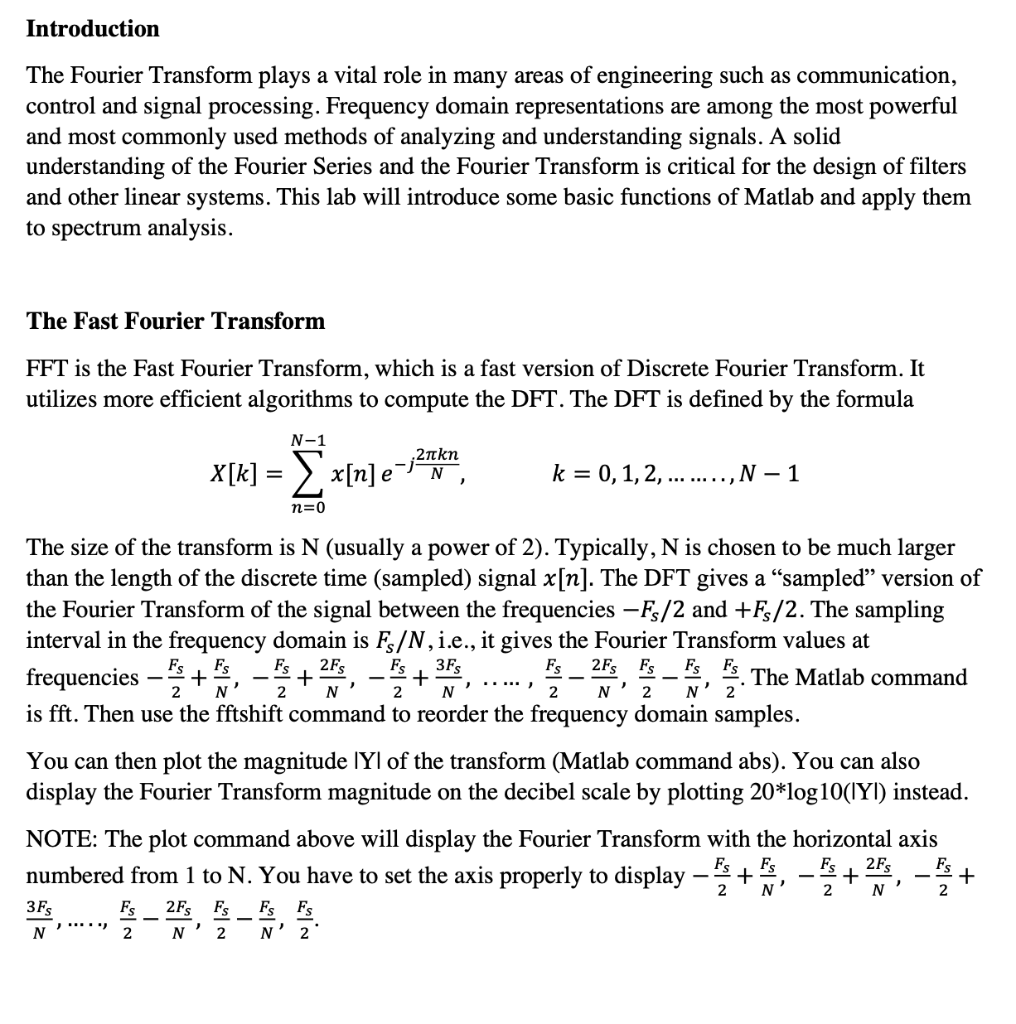
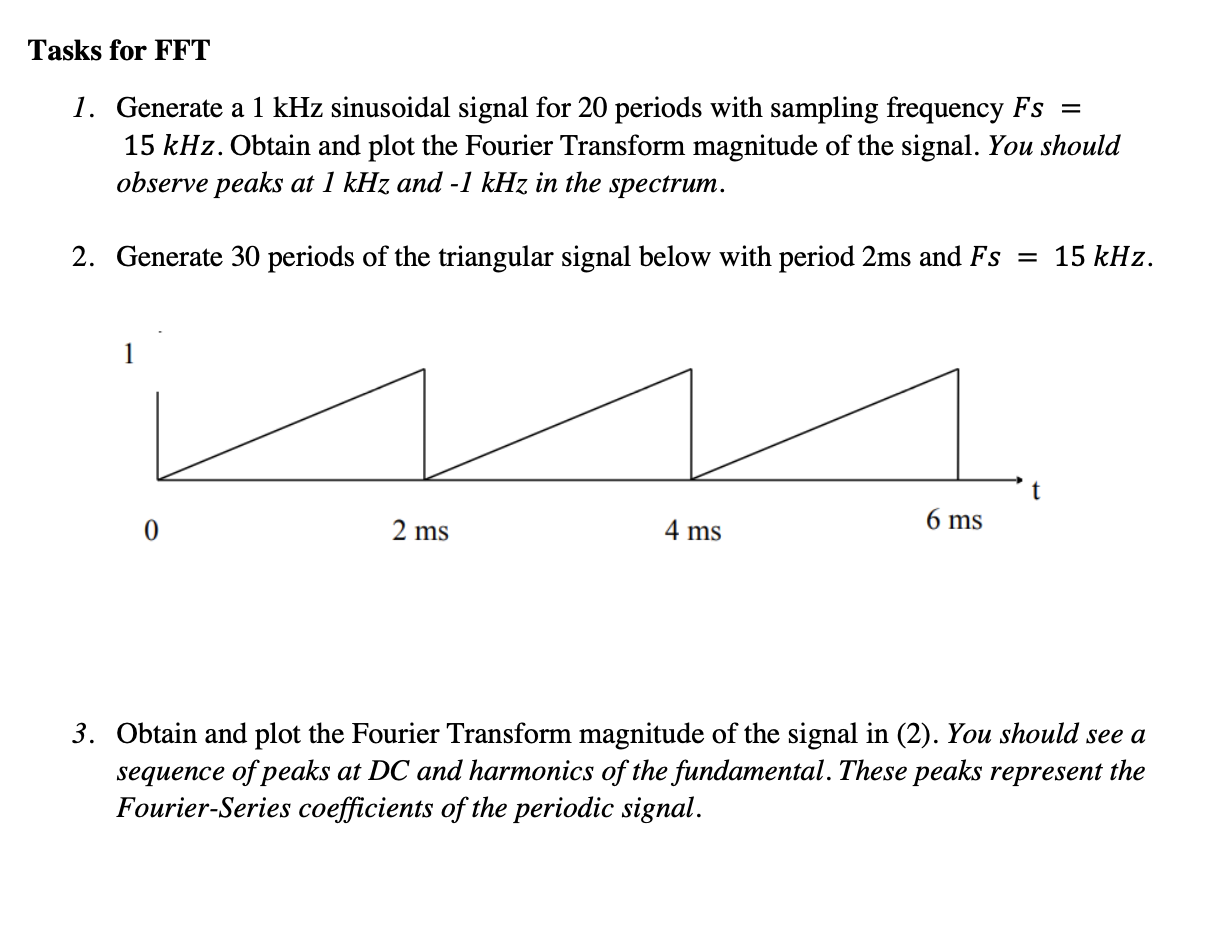
Introduction The Fourier Transform plays a vital role in many areas of engineering such as communication, control and signal processing. Frequency domain representations are among the most powerful and most commonly used methods of analyzing and understanding signals. A solid understanding of the Fourier Series and the Fourier Transform is critical for the design of filters and other linear systems. This lab will introduce some basic functions of Matlab and apply them to spectrum analysis. The Fast Fourier Transform FFT is the Fast Fourier Transform, which is a fast version of Discrete Fourier Transform. It utilizes more efficient algorithms to compute the DFT. The DFT is defined by the formula N-1 X[k] = {x[n]e -,2 kn N k = 0, 1, 2, .........,N 1 n=0 FS Fs 2 2 2 N N..., 2 N' 2 The size of the transform is N (usually a power of 2). Typically, N is chosen to be much larger than the length of the discrete time (sampled) signal x[n]. The DFT gives a sampled version of the Fourier Transform of the signal between the frequencies Fs/2 and +Ff/2. The sampling interval in the frequency domain is Fs/N, i.e., it gives the Fourier Transform values at + is, - Fs+ 2Fs 3Fs frequencies Fs 2Fs Fs + Fs Es. The Matlab command N' N' 2 is fft. Then use the fftshift command to reorder the frequency domain samples. You can then plot the magnitude IYI of the transform (Matlab command abs). You can also display the Fourier Transform magnitude on the decibel scale by plotting 20*log10(Yl) instead. NOTE: The plot command above will display the Fourier Transform with the horizontal axis abered from 1 to N. You have to set the axis properly to display - 2Fs + Fs 2Fs Fs Fs Fs Fs Fs Fs N' Fs + 2 N + 2 3Fs N 2 N2 N 2 Tasks for FFT 1. Generate a 1 kHz sinusoidal signal for 20 periods with sampling frequency Fs = 15 kHz. Obtain and plot the Fourier Transform magnitude of the signal. You should observe peaks at 1 kHz and -1 kHz in the spectrum. 2. Generate 30 periods of the triangular signal below with period 2ms and Fs = 15 kHz. t 0 2 ms 4 ms 6 ms 3. Obtain and plot the Fourier Transform magnitude of the signal in (2). You should see a sequence of peaks at DC and harmonics of the fundamental. These peaks represent the Fourier-Series coefficients of the periodic signal. Introduction The Fourier Transform plays a vital role in many areas of engineering such as communication, control and signal processing. Frequency domain representations are among the most powerful and most commonly used methods of analyzing and understanding signals. A solid understanding of the Fourier Series and the Fourier Transform is critical for the design of filters and other linear systems. This lab will introduce some basic functions of Matlab and apply them to spectrum analysis. The Fast Fourier Transform FFT is the Fast Fourier Transform, which is a fast version of Discrete Fourier Transform. It utilizes more efficient algorithms to compute the DFT. The DFT is defined by the formula N-1 X[k] = {x[n]e -,2 kn N k = 0, 1, 2, .........,N 1 n=0 FS Fs 2 2 2 N N..., 2 N' 2 The size of the transform is N (usually a power of 2). Typically, N is chosen to be much larger than the length of the discrete time (sampled) signal x[n]. The DFT gives a sampled version of the Fourier Transform of the signal between the frequencies Fs/2 and +Ff/2. The sampling interval in the frequency domain is Fs/N, i.e., it gives the Fourier Transform values at + is, - Fs+ 2Fs 3Fs frequencies Fs 2Fs Fs + Fs Es. The Matlab command N' N' 2 is fft. Then use the fftshift command to reorder the frequency domain samples. You can then plot the magnitude IYI of the transform (Matlab command abs). You can also display the Fourier Transform magnitude on the decibel scale by plotting 20*log10(Yl) instead. NOTE: The plot command above will display the Fourier Transform with the horizontal axis abered from 1 to N. You have to set the axis properly to display - 2Fs + Fs 2Fs Fs Fs Fs Fs Fs Fs N' Fs + 2 N + 2 3Fs N 2 N2 N 2 Tasks for FFT 1. Generate a 1 kHz sinusoidal signal for 20 periods with sampling frequency Fs = 15 kHz. Obtain and plot the Fourier Transform magnitude of the signal. You should observe peaks at 1 kHz and -1 kHz in the spectrum. 2. Generate 30 periods of the triangular signal below with period 2ms and Fs = 15 kHz. t 0 2 ms 4 ms 6 ms 3. Obtain and plot the Fourier Transform magnitude of the signal in (2). You should see a sequence of peaks at DC and harmonics of the fundamental. These peaks represent the Fourier-Series coefficients of the periodic signal
Step by Step Solution
There are 3 Steps involved in it

Get step-by-step solutions from verified subject matter experts