

Question: use Matlab code to do the following 2. The city council looked to know the distribution of ages in the city. After reviewing the data,
use Matlab code to do the following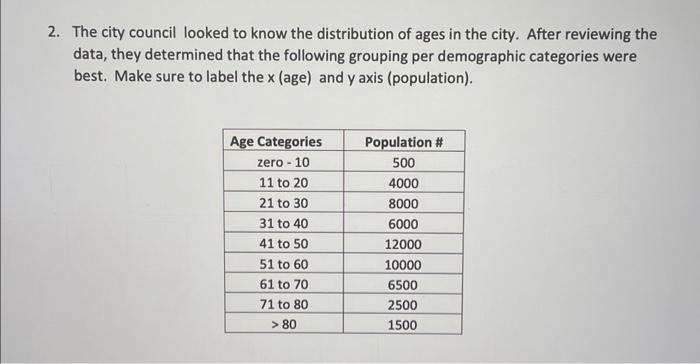
2. The city council looked to know the distribution of ages in the city. After reviewing the data, they determined that the following grouping per demographic categories were best. Make sure to label the x (age) and y axis (population). Age Categories Population # zero-10 500 11 to 20 4000 21 to 30 8000 31 to 40 6000 41 to 50 12000 51 to 60 10000 61 to 70 6500 71 to 80 2500 > 80 1500
Step by Step Solution
There are 3 Steps involved in it
Sure You can use the following Matlab code to create a bar graph based on the given data matlab ... View full answer

Get step-by-step solutions from verified subject matter experts