

Question: USE MATLAB ONLY! DO ON COMPUTER OR WRITE CLEARLY! DRAW THE FLOWCHART OF THE NEXT PROGRAM USE THESE FIGURES TO DO THE FLOWCHART: HERE IS
USE MATLAB ONLY! DO ON COMPUTER OR WRITE CLEARLY!
DRAW THE FLOWCHART OF THE NEXT PROGRAM
USE THESE FIGURES TO DO THE FLOWCHART:
HERE IS AN EXAMPLE:
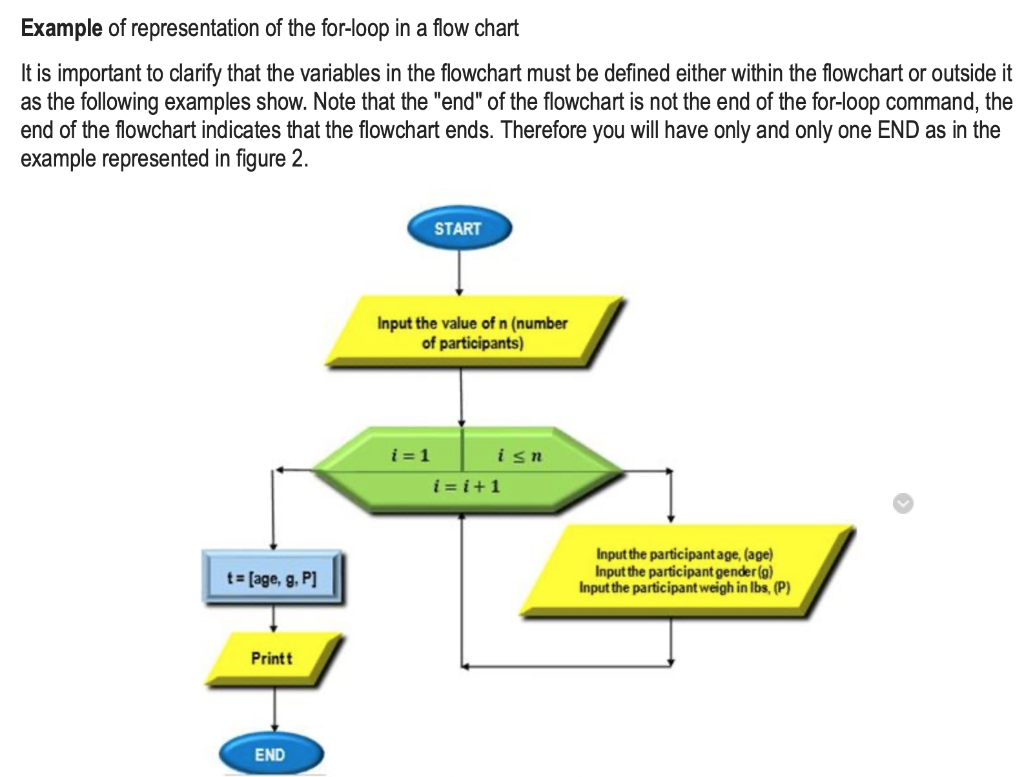
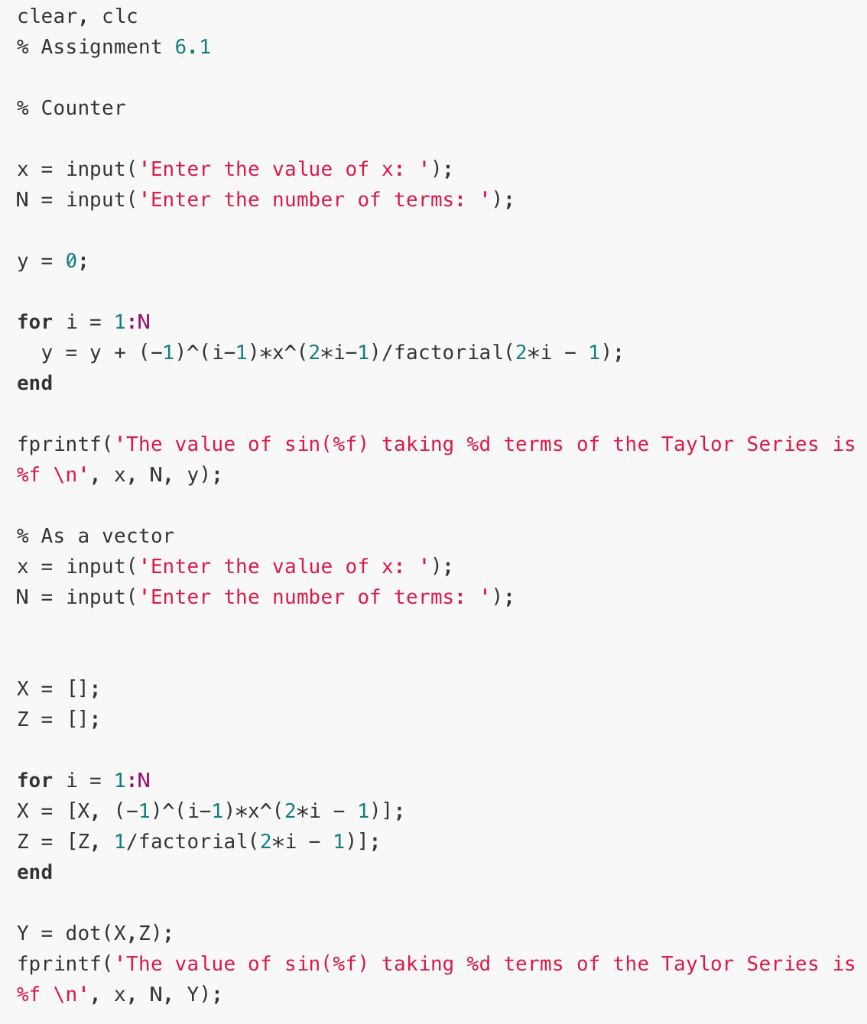
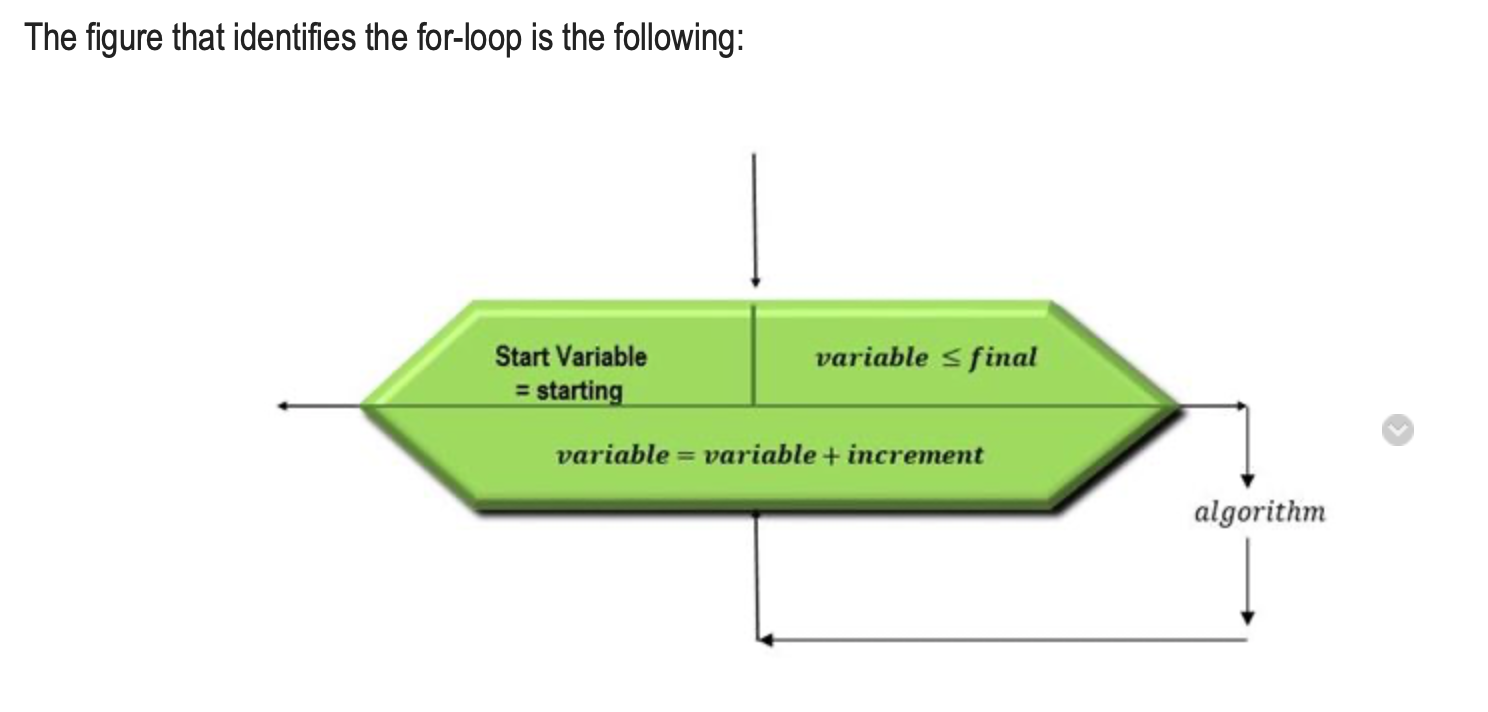
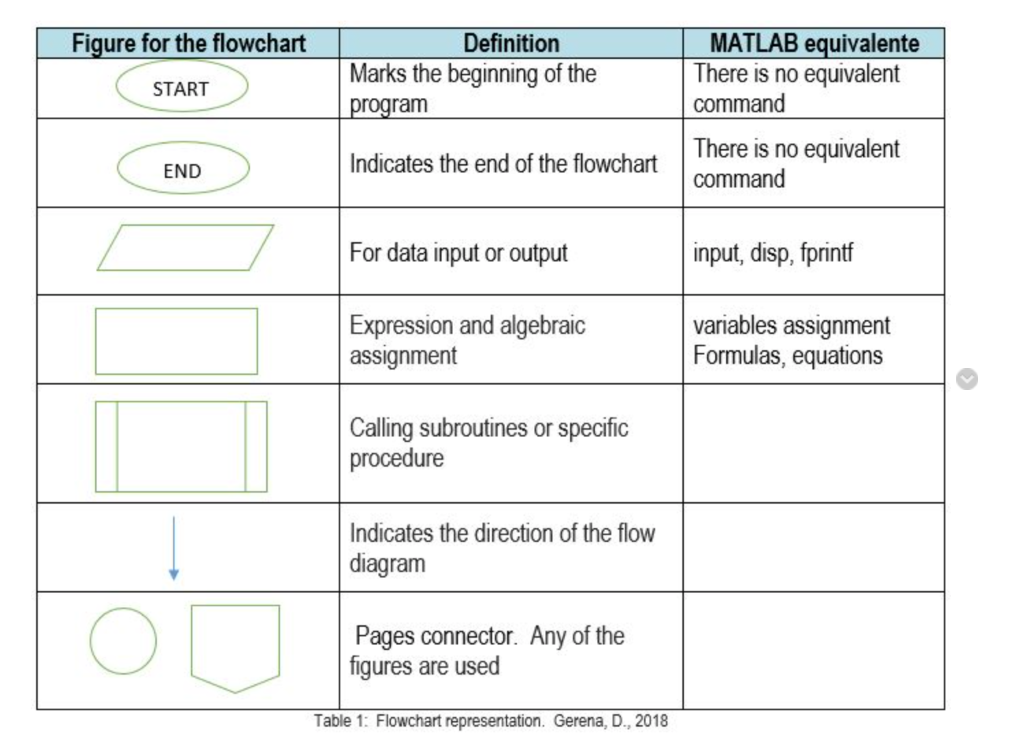
clear, clc % Assignment 6.1 % Counter x = input('Enter the value of x: '); N = input('Enter the number of terms: '); y = 0; for i = 1:0 y = y + (-1)^(i-1)*x^(2*1-1)/factorial(2*i - 1); end fprintf('The value of sin(%) taking %d terms of the Taylor Series is %f ', X, N, y); % As a vector x = input('Enter the value of x: '); N = input('Enter the number of terms: '); X = []; z = []; for i = 1:N X = [X, (-1)^(1-1)*x^(2*i - 1)]; z = [Z, 1/factorial(2*i - 1)]; end Y = dot(X,Z); fprintf('The value of sin(%f) taking %d terms of the Taylor Series is %f ', X, N, Y); The figure that identifies the for-loop is the following: Start Variable = starting variable sfinal variable = variable + increment algorithm Figure for the flowchart START Definition Marks the beginning of the program MATLAB equivalente There is no equivalent command END Indicates the end of the flowchart There is no equivalent command For data input or output input, disp, fprintf Expression and algebraic assignment variables assignment Formulas, equations Calling subroutines or specific procedure Indicates the direction of the flow diagram Pages connector. Any of the figures are used Table 1: Flowchart representation. Gerena, D., 2018 Example of representation of the for-loop in a flow chart It is important to clarify that the variables in the flowchart must be defined either within the flowchart or outside it as the following examples show. Note that the "end" of the flowchart is not the end of the for-loop command, the end of the flowchart indicates that the flowchart ends. Therefore you will have only and only one END as in the example represented in figure 2. START Input the value of n (number of participants) i=1 isn i=i+1 t = [age, g, P] Input the participant age, (age) Input the participant gender (9) Input the participant weigh in lbs, (P) Printt END
Step by Step Solution
There are 3 Steps involved in it

Get step-by-step solutions from verified subject matter experts