

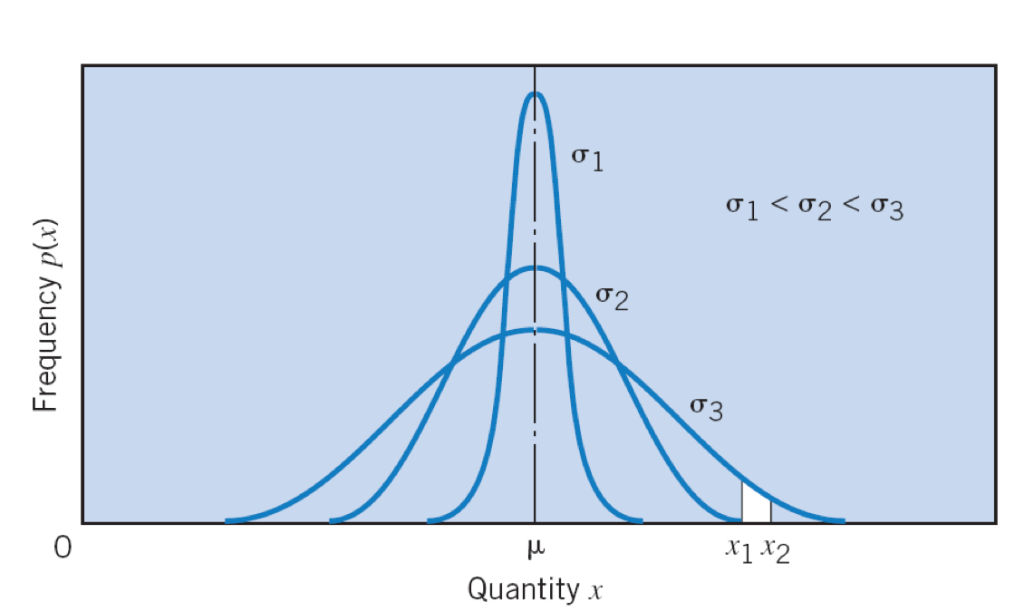
Question: Use Matlab or Excel to plot three normal distribution curves as shown in the figure with: 1=1; 2=2; 3=3; statistical means are all zero Plot
Use Matlab or Excel to plot three normal distribution curves as shown in the figure with:
1=1; 2=2; 3=3;
statistical means are all zero
Plot the three curves on one plot with axes numbered and labeled
1 2 0 *1 2 Quantityr
Step by Step Solution
There are 3 Steps involved in it
1 Expert Approved Answer
Step: 1 Unlock

Question Has Been Solved by an Expert!
Get step-by-step solutions from verified subject matter experts
Step: 2 Unlock
Step: 3 Unlock