

Question: Use MATLAB or Scilab to solve the following problems 1. Create a MATLAB subroutne called Lagrange.m that receives two set data points, x and y
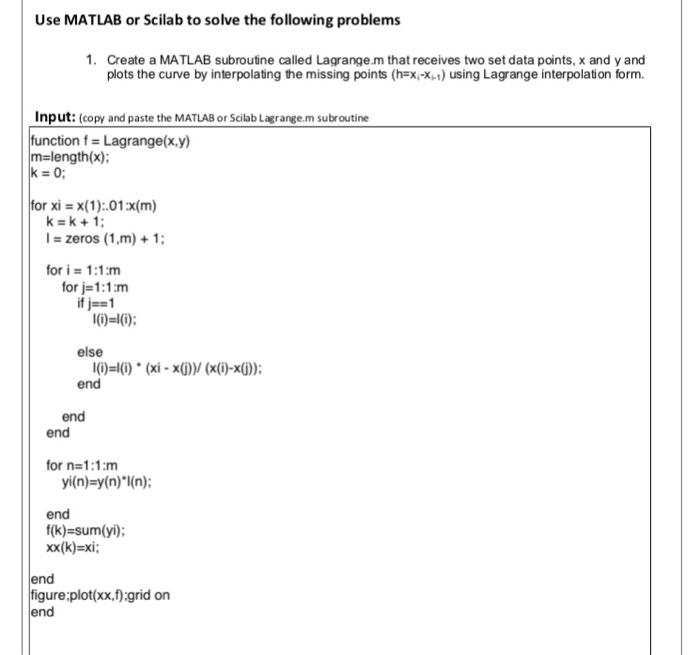

Use MATLAB or Scilab to solve the following problems 1. Create a MATLAB subroutne called Lagrange.m that receives two set data points, x and y and plots the curve by interpolating the missing points (hex,-X.) using Lagrange interpolation form. Input: (copy and paste the MATLAB or Scilab Lagrangem subroutine f Lagrange(x.y) m=length(x); k 0 for xi x(1):.01x(m) k k+1 I- zeros (1,m)1 for i 1:1m for j-1:1mm else 0)-()(xix0(x()-x0)); end end for n 1:1m yi(n)-y(n)(n) end f(k)-sum(yi); xx(k)-xi end figure:plotxx,):grid on end Use MATLAB or Scilab to solve the following problems 1. Create a MATLAB subroutne called Lagrange.m that receives two set data points, x and y and plots the curve by interpolating the missing points (hex,-X.) using Lagrange interpolation form. Input: (copy and paste the MATLAB or Scilab Lagrangem subroutine f Lagrange(x.y) m=length(x); k 0 for xi x(1):.01x(m) k k+1 I- zeros (1,m)1 for i 1:1m for j-1:1mm else 0)-()(xix0(x()-x0)); end end for n 1:1m yi(n)-y(n)(n) end f(k)-sum(yi); xx(k)-xi end figure:plotxx,):grid on end
Step by Step Solution
There are 3 Steps involved in it

Get step-by-step solutions from verified subject matter experts