

Question: use matlab Plotting surfaces z=f(x, y) (continued) Activity Example 2 Write a script file to plot the hyperbolic paraboloid z= y2 x? for -15xsi, -1sys1
 use matlab
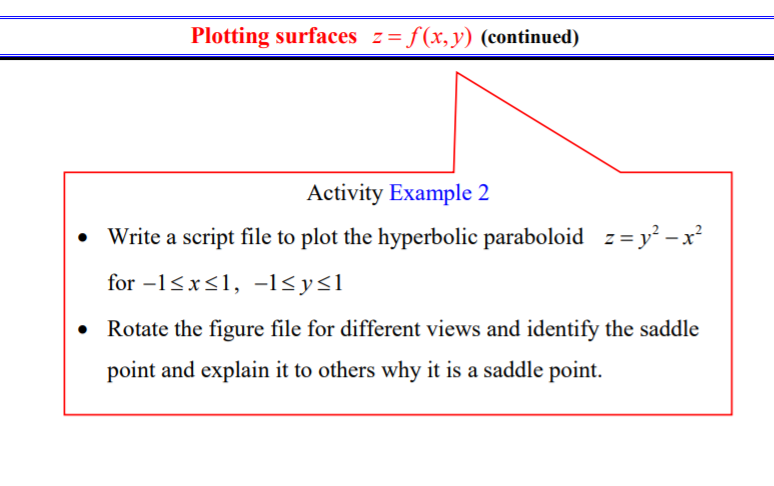
Plotting surfaces z=f(x, y) (continued) Activity Example 2 Write a script file to plot the hyperbolic paraboloid z= y2 x? for -15xsi, -1sys1 Rotate the figure file for different views and identify the saddle point and explain it to others why it is a saddle point
Step by Step Solution
There are 3 Steps involved in it
1 Expert Approved Answer
Step: 1 Unlock

Question Has Been Solved by an Expert!
Get step-by-step solutions from verified subject matter experts
Step: 2 Unlock
Step: 3 Unlock