

Question: Use MATLAB Problem 3 Create an .m script (MATLAB/Octave) to generate the vector plot illustrated in Figure 1, which represents a uniform velocity profile in
Use MATLAB
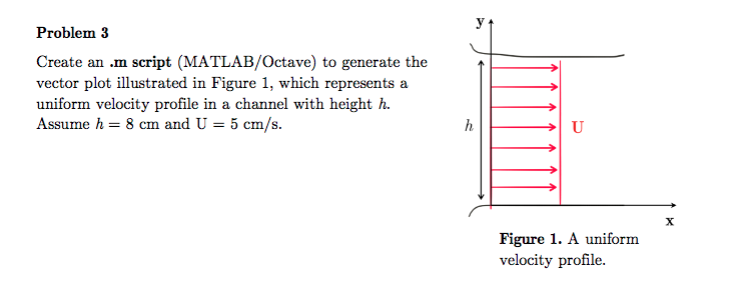
Problem 3 Create an .m script (MATLAB/Octave) to generate the vector plot illustrated in Figure 1, which represents a uniform velocity profile in a channel with height h. Assume h8 cm and U-5 cm/s. Figure 1. A uniform velocity profile
Step by Step Solution
There are 3 Steps involved in it
1 Expert Approved Answer
Step: 1 Unlock

Question Has Been Solved by an Expert!
Get step-by-step solutions from verified subject matter experts
Step: 2 Unlock
Step: 3 Unlock