

Question: Use matlab The following parametric equations shown below result in a plot of arcs. x(t) = 0.9^m (t - sin(t)) y(t) = 0.9^m (1 -
Use matlab 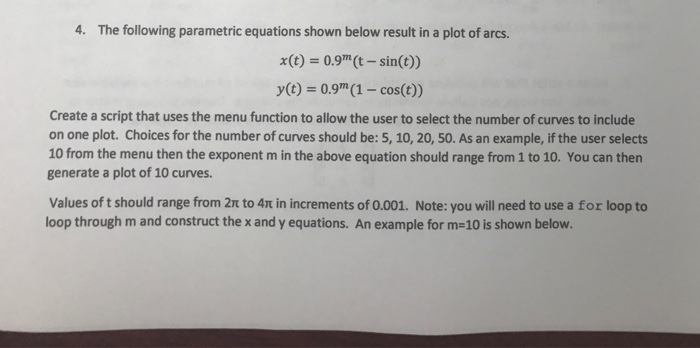
The following parametric equations shown below result in a plot of arcs. x(t) = 0.9^m (t - sin(t)) y(t) = 0.9^m (1 - cos(t)) Create a script that uses the menu function to allow the user to select the number of curves to include on one plot. Choices for the number of curves should be: 5, 10, 20, 50. As an example, if the user selects 10 from the menu then the exponent m in the above equation should range from 1 to 10. You can then generate a plot of 10 curves. Values of t should range from 2 pi to 4 pi in increments of 0.001
Step by Step Solution
There are 3 Steps involved in it
1 Expert Approved Answer
Step: 1 Unlock

Question Has Been Solved by an Expert!
Get step-by-step solutions from verified subject matter experts
Step: 2 Unlock
Step: 3 Unlock