

Question: Use MATLAB The value of can be expressed using the expression below as the square root of the summation of an infinite series. | TT
Use MATLAB
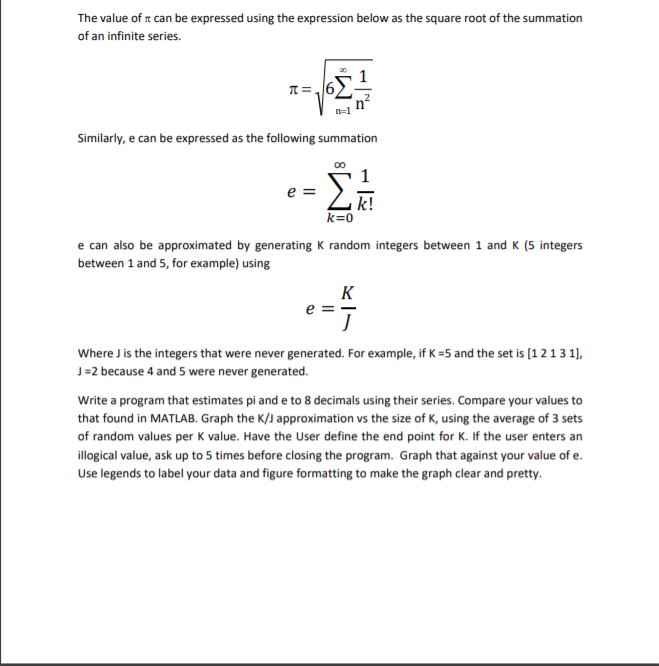
The value of can be expressed using the expression below as the square root of the summation of an infinite series. | TT = 6 Similarly, e can be expressed as the following summation 00 e = k! k=0 e can also be approximated by generating k random integers between 1 and K (5 integers between 1 and 5, for example) using K e =- J Where J is the integers that were never generated. For example, if K =5 and the set is (1 2131), J =2 because 4 and 5 were never generated. Write a program that estimates pi and e to 8 decimals using their series. Compare your values to that found in MATLAB. Graph the K/J approximation vs the size of K, using the average of 3 sets of random values per K value. Have the User define the end point for K. If the user enters an illogical value, ask up to 5 times before closing the program. Graph that against your value of e. Use legends to label your data and figure formatting to make the graph clear and pretty. The value of can be expressed using the expression below as the square root of the summation of an infinite series. | TT = 6 Similarly, e can be expressed as the following summation 00 e = k! k=0 e can also be approximated by generating k random integers between 1 and K (5 integers between 1 and 5, for example) using K e =- J Where J is the integers that were never generated. For example, if K =5 and the set is (1 2131), J =2 because 4 and 5 were never generated. Write a program that estimates pi and e to 8 decimals using their series. Compare your values to that found in MATLAB. Graph the K/J approximation vs the size of K, using the average of 3 sets of random values per K value. Have the User define the end point for K. If the user enters an illogical value, ask up to 5 times before closing the program. Graph that against your value of e. Use legends to label your data and figure formatting to make the graph clear and pretty
Step by Step Solution
There are 3 Steps involved in it

Get step-by-step solutions from verified subject matter experts