

Question: Use MATLAB to code this problem. Make sure to comment your code Include all custom functions in your published document Make it obvious when you
Use MATLAB to code this problem.
Make sure to comment your code Include all custom functions in your published document Make it obvious when you are beginning a new question (section with %%) All plots should have titles and axes labels and look good if printed black and white.
Problem 5:Use the Cost and Frequency (Freq) data from the provided dataset (DS1_Matlab_Data.mat) and plot the points with frequency on the horizontal axis. Interpolate the data to get a smoother curve and plot it against the raw data. This is the dataset
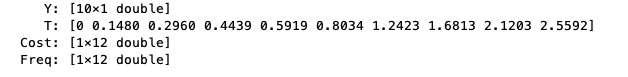
Y: (10x1 double] T: (0 0.1480 0.2960 0.4439 0.5919 0.8034 1.2423 1.6813 2.1203 2.5592) Cost: [1x12 double] Freq: [1x12 double] Y: (10x1 double] T: (0 0.1480 0.2960 0.4439 0.5919 0.8034 1.2423 1.6813 2.1203 2.5592) Cost: [1x12 double] Freq: [1x12 double]
Step by Step Solution
There are 3 Steps involved in it

Get step-by-step solutions from verified subject matter experts