

Question: Use MATLAB to construct the following filters. (a) Design a high pass filter with a passband frequency of 0.5 rad/sample and the stopband frequency
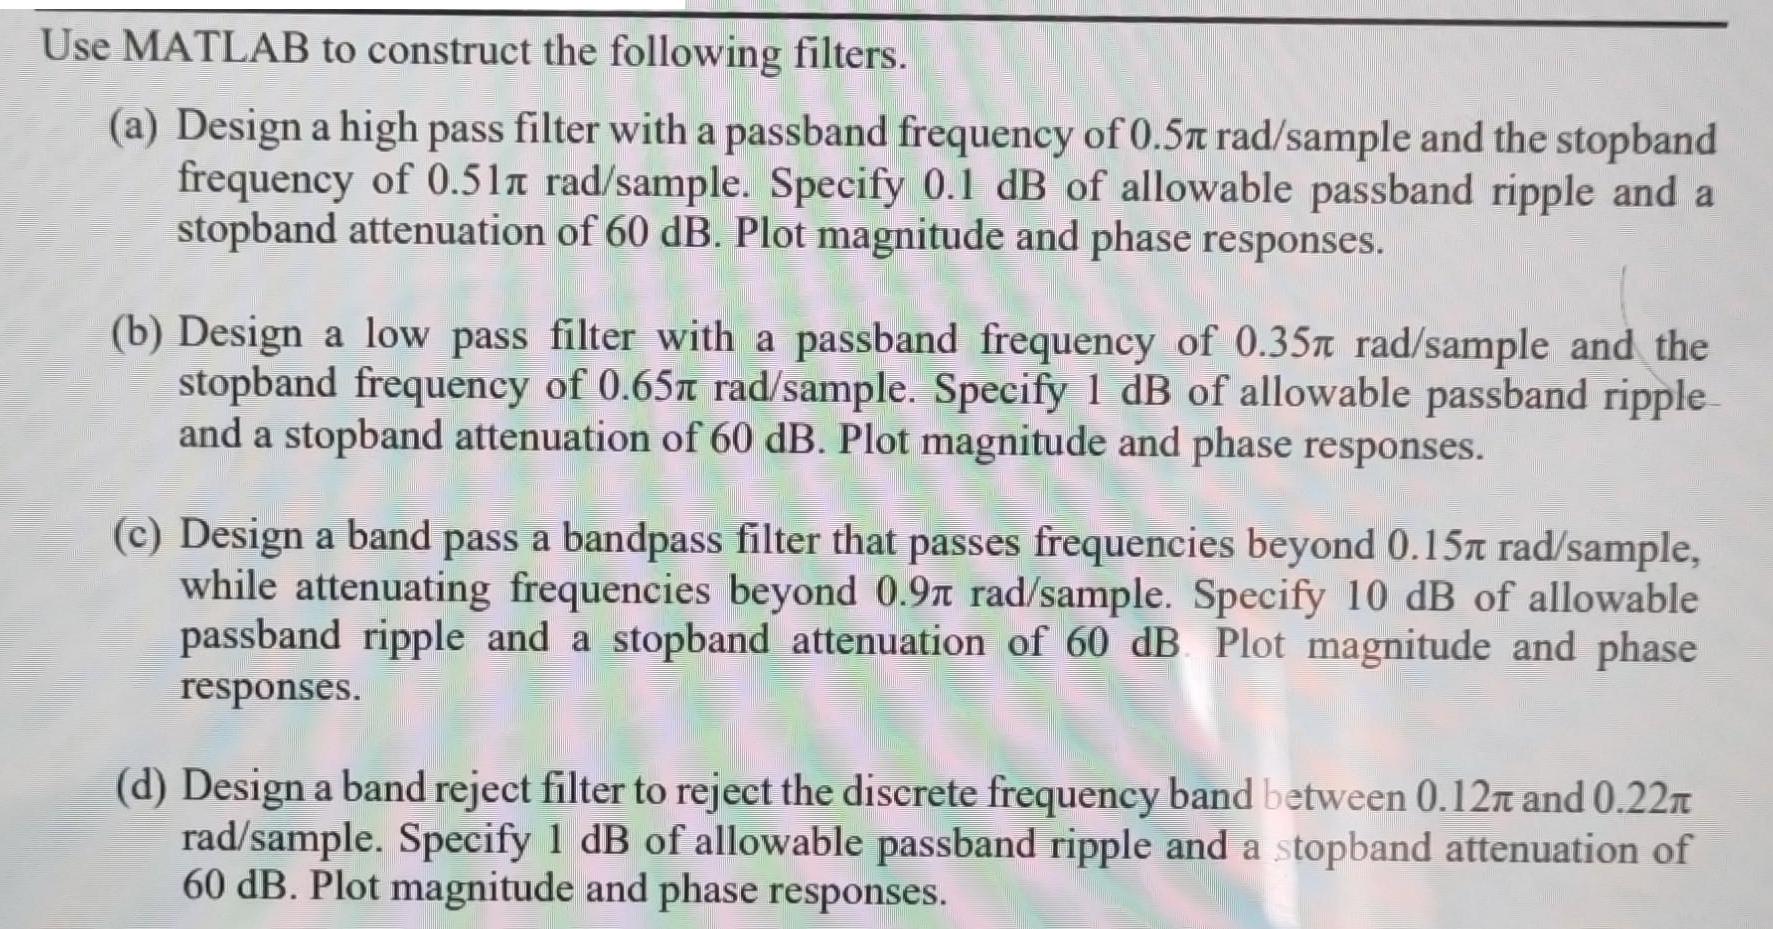
Use MATLAB to construct the following filters. (a) Design a high pass filter with a passband frequency of 0.5 rad/sample and the stopband frequency of 0.51 rad/sample. Specify 0.1 dB of allowable passband ripple and a stopband attenuation of 60 dB. Plot magnitude and phase responses. (b) Design a low pass filter with a passband frequency of 0.35 rad/sample and the stopband frequency of 0.65 rad/sample. Specify 1 dB of allowable passband ripple and a stopband attenuation of 60 dB. Plot magnitude and phase responses. (c) Design a band pass a bandpass filter that passes frequencies beyond 0.15 rad/sample, while attenuating frequencies beyond 0.97 rad/sample. Specify 10 dB of allowable passband ripple and a stopband attenuation of 60 dB. Plot magnitude and phase responses. (d) Design a band reject filter to reject the discrete frequency band between 0.127 and 0.22m rad/sample. Specify 1 dB of allowable passband ripple and a stopband attenuation of 60 dB. Plot magnitude and phase responses.
Step by Step Solution
3.41 Rating (151 Votes )
There are 3 Steps involved in it
SOLUTION To design the given filters and plot their magnitude and phase responses in MATLAB you can use the firpm function from the Signal Processing ... View full answer

Get step-by-step solutions from verified subject matter experts