

Question: Use Matlab to generate code. Please post Code and Graphs Generate and plot the signal represented by x 5 u ( t ) = e
Use Matlab to generate code. Please post Code and Graphs
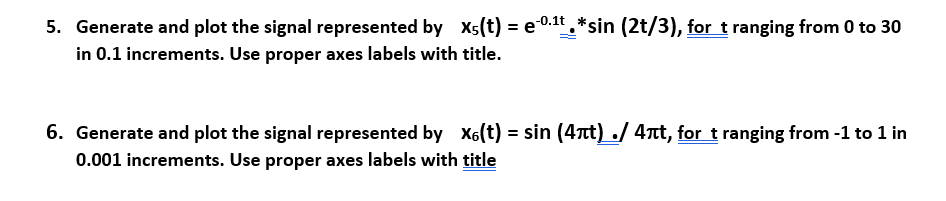
Generate and plot the signal represented by for ranging from to
in increments. Use proper axes labels with title.
Generate and plot the signal represented by for ranging from to in
increments. Use proper axes labels with title
Step by Step Solution
There are 3 Steps involved in it
1 Expert Approved Answer
Step: 1 Unlock

Question Has Been Solved by an Expert!
Get step-by-step solutions from verified subject matter experts
Step: 2 Unlock
Step: 3 Unlock