

Question: Use Matlab to implement the following : 1 : Make stem plots of the following signals. Decide for yourself what the range of n should
Use Matlab to implement the following :
:
Make stem plots of the following signals. Decide for yourself what the range of should be
where :
:
Determine whether the following signals are energy signals, power signal, or neither.
a
b
c
d
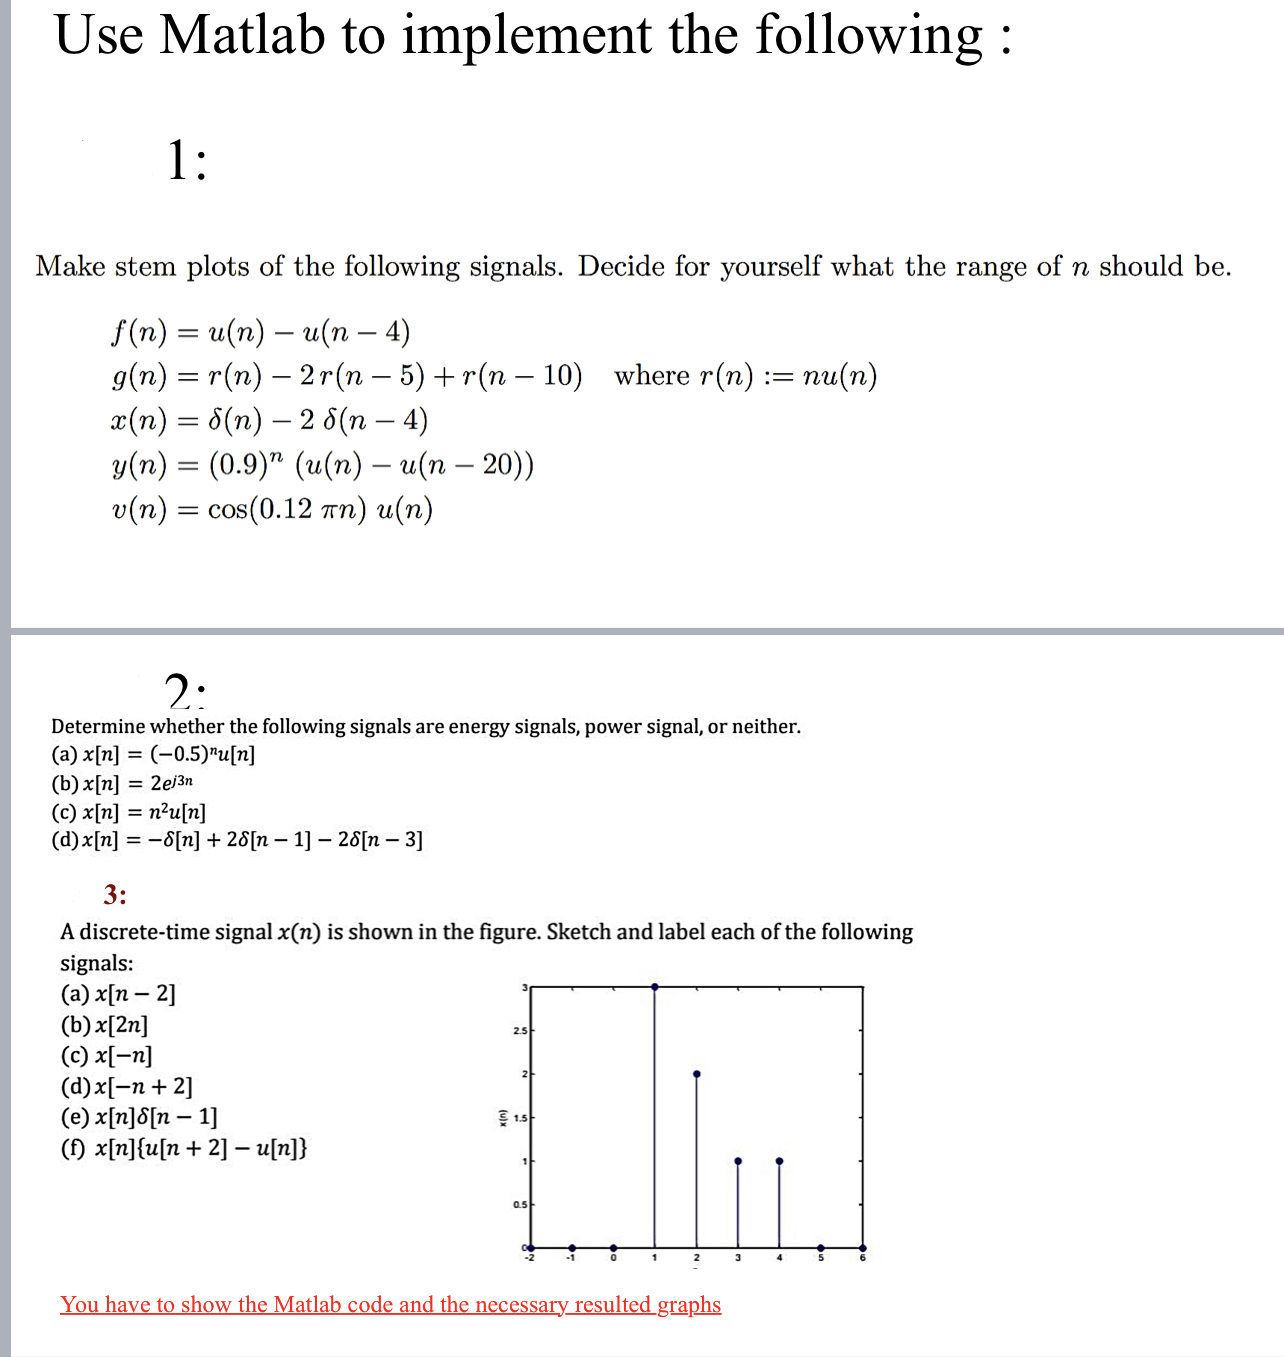
:
A discretetime signal is shown in the figure. Sketch and label each of the following signals:
a
b
c
d
e
f
You have to show the Matlab code and the necessary resulted graphs
Step by Step Solution
There are 3 Steps involved in it
1 Expert Approved Answer
Step: 1 Unlock

Question Has Been Solved by an Expert!
Get step-by-step solutions from verified subject matter experts
Step: 2 Unlock
Step: 3 Unlock