

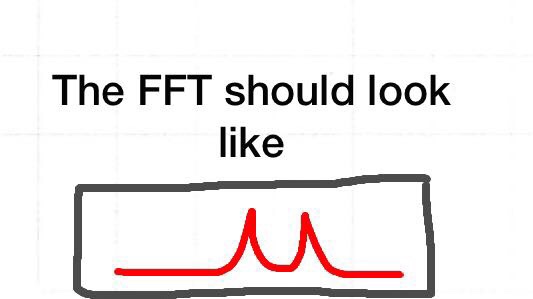
Question: Use Matlab to plot FFT for this sine wave. Make sure to label the plot. Plots shape is also drawn. 2 0 0.5 1.5 2.5
Use Matlab to plot FFT for this sine wave. Make sure to label the plot. Plots shape is also drawn. 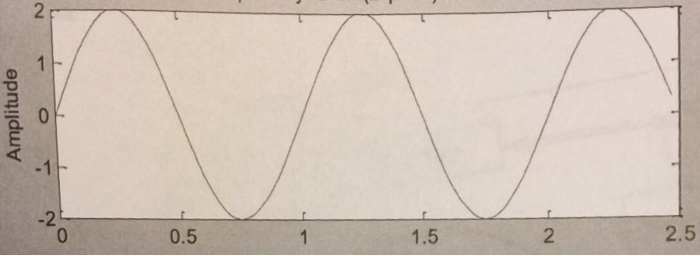
2 0 0.5 1.5 2.5 2 1 2 01 epryiduuV
Step by Step Solution
There are 3 Steps involved in it
1 Expert Approved Answer
Step: 1 Unlock

Question Has Been Solved by an Expert!
Get step-by-step solutions from verified subject matter experts
Step: 2 Unlock
Step: 3 Unlock