

Question: Use MATLAB to solve and plot for 'problem 3' only Module 3: z-transforms 1. Consider the signal x[n] = a, a = 0.6, n =
Use MATLAB to solve and plot for 'problem 3' only
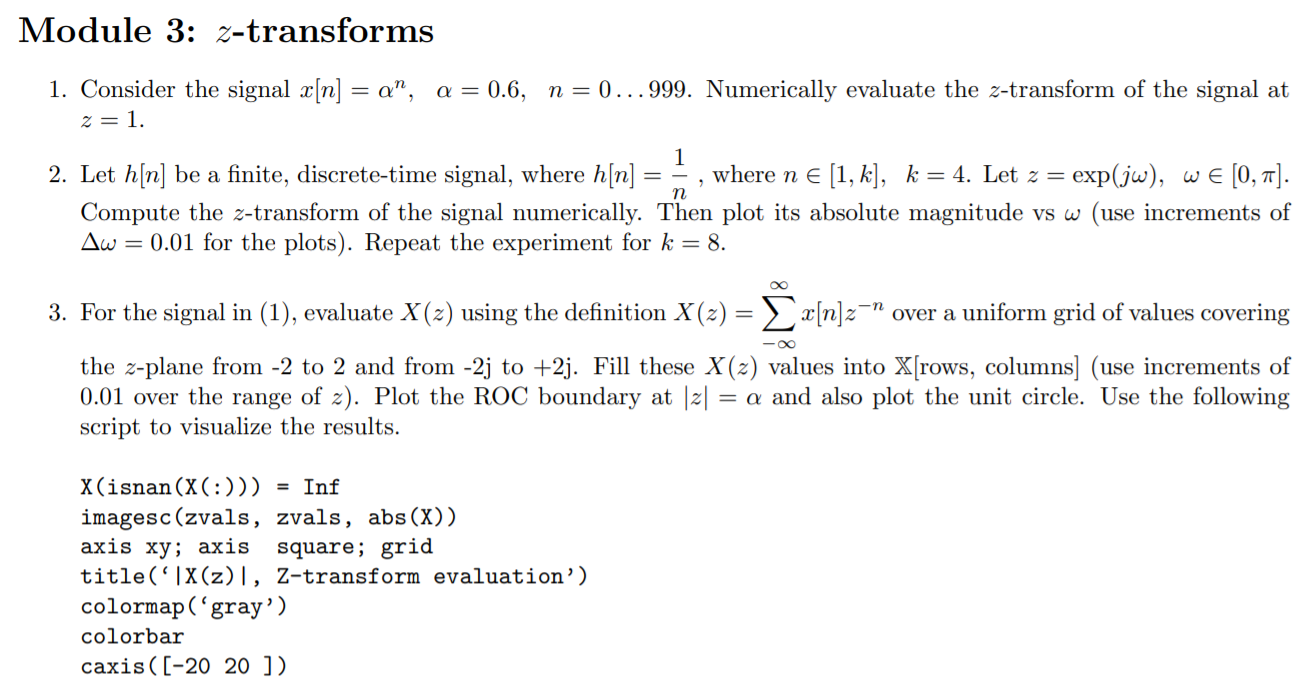
Module 3: z-transforms 1. Consider the signal x[n] = a", a = 0.6, n = 0...999. Numerically evaluate the z-transform of the signal at 2= 1. 2. Let h[n] be a finite, discrete-time signal, where h[n] = =, where ne [1, k], k = 4. Let z = exp(jw), we [0, 1]. Compute the z-transform of the signal numerically. Then plot its absolute magnitude vs w (use increments of Aw = 0.01 for the plots). Repeat the experiment for k = 8. 3. For the signal in (1), evaluate X(z) using the definition X(z) = x[n]z-n over a uniform grid of values covering - the z-plane from -2 to 2 and from -2j to +2j. Fill these X(z) values into X[rows, columns) (use increments of 0.01 over the range of z). Plot the ROC boundary at [2] = a and also plot the unit circle. Use the following script to visualize the results. X(isnan(x(:))) = Inf imagesc(zvals, zvals, abs (X)) axis xy; axis square; grid title('|X(z)), Z-transform evaluation') colormap('gray') colorbar caxis ([-20 20 ]) Module 3: z-transforms 1. Consider the signal x[n] = a", a = 0.6, n = 0...999. Numerically evaluate the z-transform of the signal at 2= 1. 2. Let h[n] be a finite, discrete-time signal, where h[n] = =, where ne [1, k], k = 4. Let z = exp(jw), we [0, 1]. Compute the z-transform of the signal numerically. Then plot its absolute magnitude vs w (use increments of Aw = 0.01 for the plots). Repeat the experiment for k = 8. 3. For the signal in (1), evaluate X(z) using the definition X(z) = x[n]z-n over a uniform grid of values covering - the z-plane from -2 to 2 and from -2j to +2j. Fill these X(z) values into X[rows, columns) (use increments of 0.01 over the range of z). Plot the ROC boundary at [2] = a and also plot the unit circle. Use the following script to visualize the results. X(isnan(x(:))) = Inf imagesc(zvals, zvals, abs (X)) axis xy; axis square; grid title('|X(z)), Z-transform evaluation') colormap('gray') colorbar caxis ([-20 20 ])
Step by Step Solution
There are 3 Steps involved in it

Get step-by-step solutions from verified subject matter experts