

Question: USE MATLAB! USE MATLAB! QUESTION 1: The I-V (current-voltage) curve of a photovoltaic (PV) module describes its energy conversion capability at the existing conditions of
USE MATLAB!
USE MATLAB!
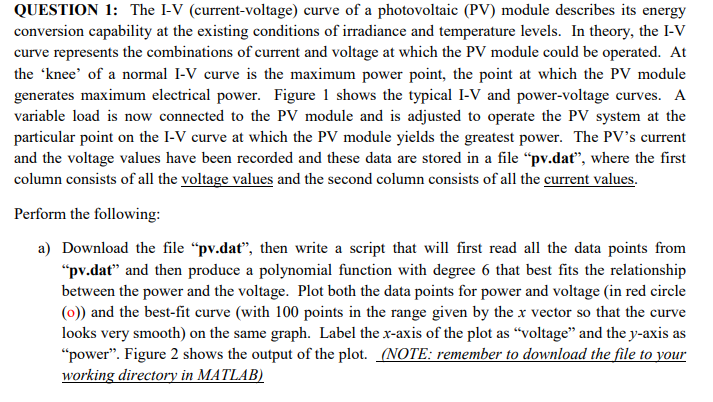
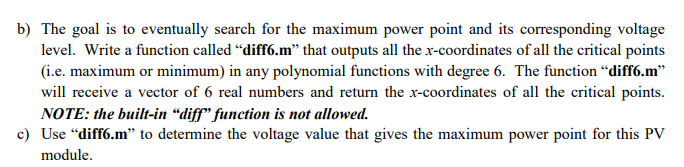
QUESTION 1: The I-V (current-voltage) curve of a photovoltaic (PV) module describes its energy conversion capability at the existing conditions of irradiance and temperature levels. In theory, the I-V curve represents the combinations of current and voltage at which the PV module could be operated. At the knee of a normal I-V curve is the maximum power point, the point at which the PV module generates maximum electrical power. Figure 1 shows the typical I-V and power-voltage curves. A variable load is now connected to the PV module and is adjusted to operate the PV system at the particular point on the I-V curve at which the PV module yields the greatest power. The PV's current and the voltage values have been recorded and these data are stored in a file pv.dat", where the first column consists of all the voltage values and the second column consists of all the current values. Perform the following: a) Download the file pv.dat", then write a script that will first read all the data points from pv.dat and then produce a polynomial function with degree 6 that best fits the relationship between the power and the voltage. Plot both the data points for power and voltage (in red circle ()) and the best-fit curve (with 100 points in the range given by the x vector so that the curve looks very smooth) on the same graph. Label the x-axis of the plot as voltage and the y-axis as power. Figure 2 shows the output of the plot. (NOTE: remember to download the file to your working directory in MATLAB) b) The goal is to eventually search for the maximum power point and its corresponding voltage level. Write a function called diff6.m that outputs all the x-coordinates of all the critical points (i.e. maximum or minimum) in any polynomial functions with degree 6. The function diff6.m will receive a vector of 6 real numbers and return the x-coordinates of all the critical points. NOTE: the built-in diff function is not allowed. c) Use "diff6.m to determine the voltage value that gives the maximum power point for this PV module. . V Mar Figure 1 120 100 80 60 power [W] 40 20 original data points best fit cruve with degree 6 -20 5 10 15 20 25 voltage [V] Figure 2
Step by Step Solution
There are 3 Steps involved in it

Get step-by-step solutions from verified subject matter experts