

Question: USE MATLAP PLEASE!! Step 4 - Analyze some previous data 1. Use readmatrix to read in the data in EGR121Lottery Wins.xIsx, from 4 different sheets
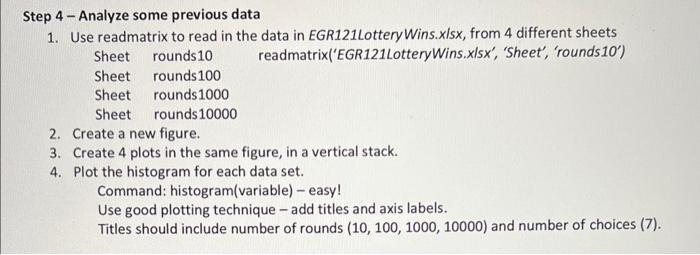
Step 4 - Analyze some previous data 1. Use readmatrix to read in the data in EGR121Lottery Wins.xIsx, from 4 different sheets Sheet rounds 10 readmatrix('EGR121LotteryWins.x/sx', 'Sheet', 'rounds 10 ') Sheet rounds 100 Sheet rounds 1000 Sheet rounds 10000 2. Create a new figure. 3. Create 4 plots in the same figure, in a vertical stack. 4. Plot the histogram for each data set. Command: histogram(variable) - easy! Use good plotting technique - add titles and axis labels. Titles should include number of rounds (10,100,1000,10000) and number of choices (7). Step 4 - Analyze some previous data 1. Use readmatrix to read in the data in EGR121Lottery Wins.xIsx, from 4 different sheets Sheet rounds 10 readmatrix('EGR121LotteryWins.x/sx', 'Sheet', 'rounds 10 ') Sheet rounds 100 Sheet rounds 1000 Sheet rounds 10000 2. Create a new figure. 3. Create 4 plots in the same figure, in a vertical stack. 4. Plot the histogram for each data set. Command: histogram(variable) - easy! Use good plotting technique - add titles and axis labels. Titles should include number of rounds (10,100,1000,10000) and number of choices (7)
Step by Step Solution
There are 3 Steps involved in it

Get step-by-step solutions from verified subject matter experts