

Question: Use Microsoft Excel to run a regression analysis, then do the following 1. Determine the company's cost equation (use the output from the Excel 2.
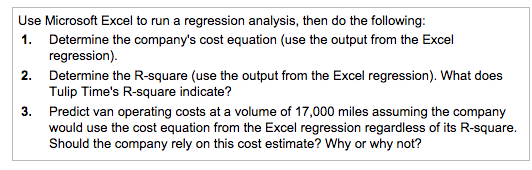
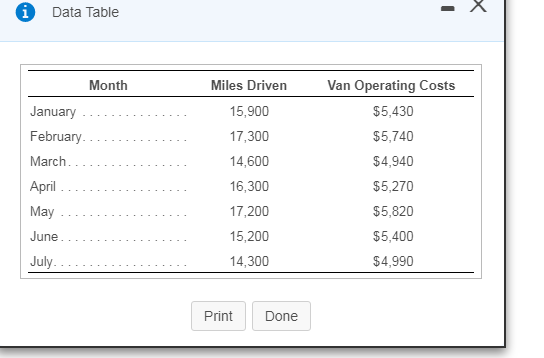
Use Microsoft Excel to run a regression analysis, then do the following 1. Determine the company's cost equation (use the output from the Excel 2. Determine the R-square (use the output from the Excel regression). What does 3. Predict van operating costs at a volume of 17,000 miles assuming the company regression) Tulip Time's R-square indicate? would use the cost equation from the Excel regression regardless of its R-square Should the company rely on this cost estimate? Why or why not? Data Table Month January February March April May June Miles Driven 15,900 17,300 14,600 16,300 17,200 15,200 14,300 Van Operating Costs $5,430 $5,740 $4,940 $5,270 $5,820 $5,400 $4,990 Print Done Use Microsoft Excel to run a regression analysis, then do the following 1. Determine the company's cost equation (use the output from the Excel 2. Determine the R-square (use the output from the Excel regression). What does 3. Predict van operating costs at a volume of 17,000 miles assuming the company regression) Tulip Time's R-square indicate? would use the cost equation from the Excel regression regardless of its R-square Should the company rely on this cost estimate? Why or why not? Data Table Month January February March April May June Miles Driven 15,900 17,300 14,600 16,300 17,200 15,200 14,300 Van Operating Costs $5,430 $5,740 $4,940 $5,270 $5,820 $5,400 $4,990 Print Done
Step by Step Solution
There are 3 Steps involved in it

Get step-by-step solutions from verified subject matter experts