

Question: Use my data in STEP 1 to generate a scatterplot, find the residuals and make a histogram, determain if the residuals are approx normal, generate
Use my data in STEP 1 to generate a scatterplot, find the residuals and make a histogram, determain if the residuals are approx normal, generate a residual plot, determain if the linear regression model is. agood fit for the data, determain t-stat and p value, interpret the p value in the context of the problem, conclude if we reject or fail the null
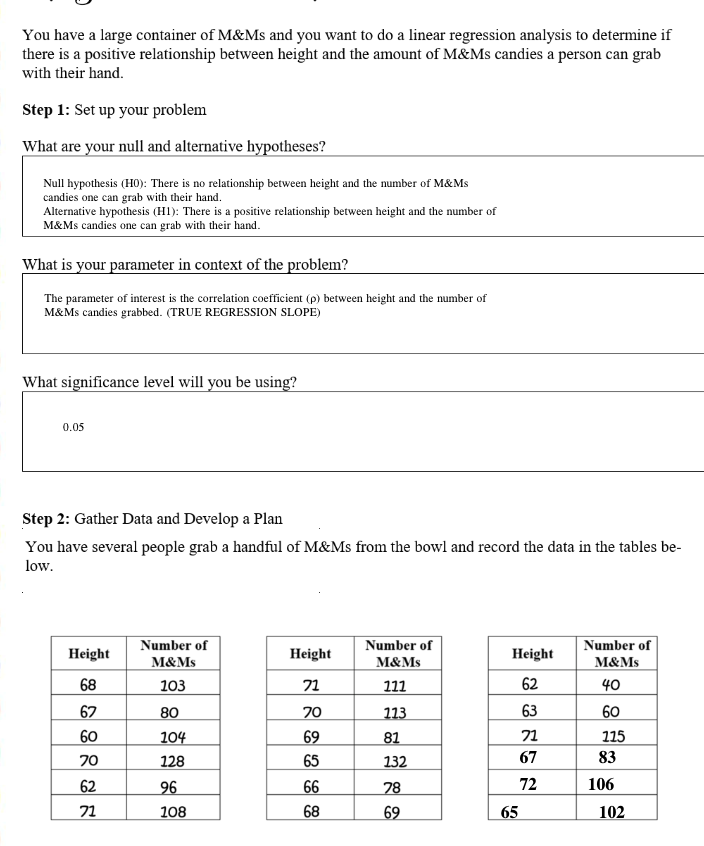
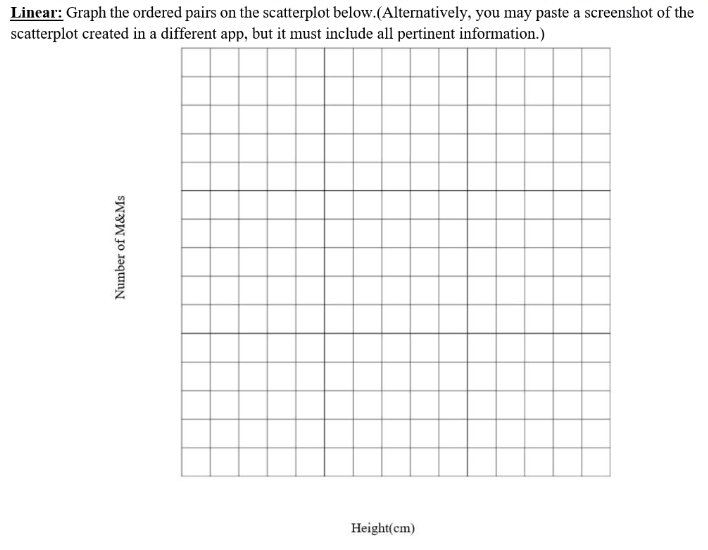
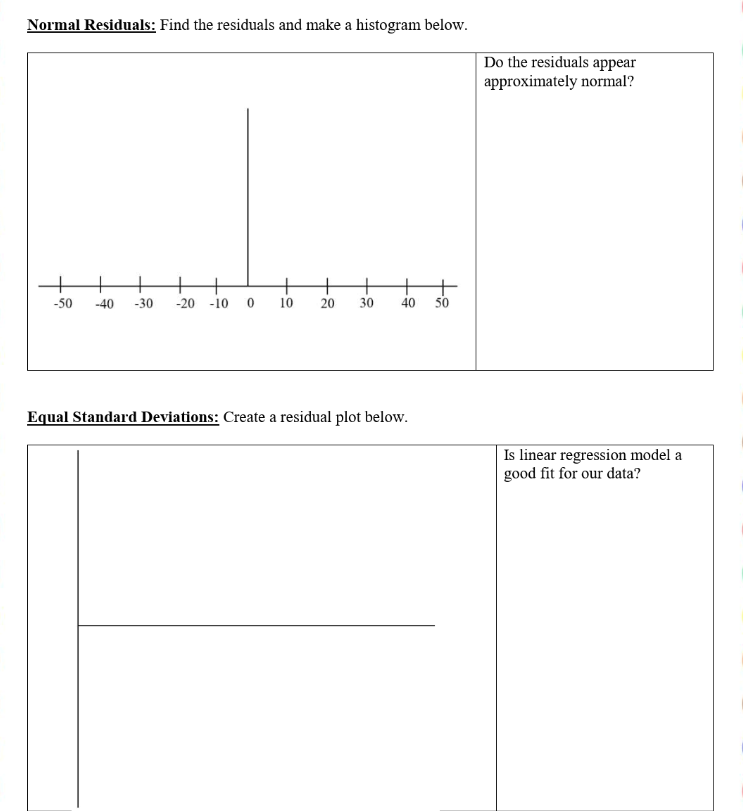
You have a large container of M&Ms and you want to do a linear regression analysis to determine if there is a positive relationship between height and the amount of M&Ms candies a person can grab with their hand. Step 1: Set up your problem What are your null and alternative hypotheses? Null hypothesis (HO): There is no relationship between height and the number of M&Ms candies one can grab with their hand. Alternative hypothesis (HI): There is a positive relationship between height and the number of M&Ms candies one can grab with their hand. What is your parameter in context of the problem? The parameter of interest is the correlation coefficient (p) between height and the number of M&Ms candies grabbed. (TRUE REGRESSION SLOPE) What significance level will you be using? 0.05 Step 2: Gather Data and Develop a Plan You have several people grab a handful of M&Ms from the bowl and record the data in the tables be- low. Height Number of Number of M&Ms Height Number of M&Ms Height M&Ms 68 103 71 111 62 40 67 80 70 113 63 60 60 104 69 81 71 115 70 128 65 132 67 83 62 96 66 78 72 106 71 108 68 69 65 102Linear: Graph the ordered pairs on the scatterplot below.(Alternatively, you may paste a screenshot of the scatterplot created in a different app, but it must include all pertinent information.) Number of M&Ms Height(cm) Normal Residuals: Find the residuals and make a histogram below. Do the residuals appear approximately normal? -50 40 30 -20 -10 O 10 20 M 40 50 Equal Standard Deviations: Create a residual plot below. Is linear regression model a good fit for our data? Step 3: Even if some of your conditions were not met, determine your t-statistic and p-value. Show all work! Step 4: Conclude Interpret the p-value in the context of the problem Do we reject or fail to reject the null hypothesis? Why or why not
Step by Step Solution
There are 3 Steps involved in it

Get step-by-step solutions from verified subject matter experts