

Question: Use n = 6 and p = 0.35 to complete parts (a) through (d) below. (a) Construct a binomial probability distribution with the given parameters.
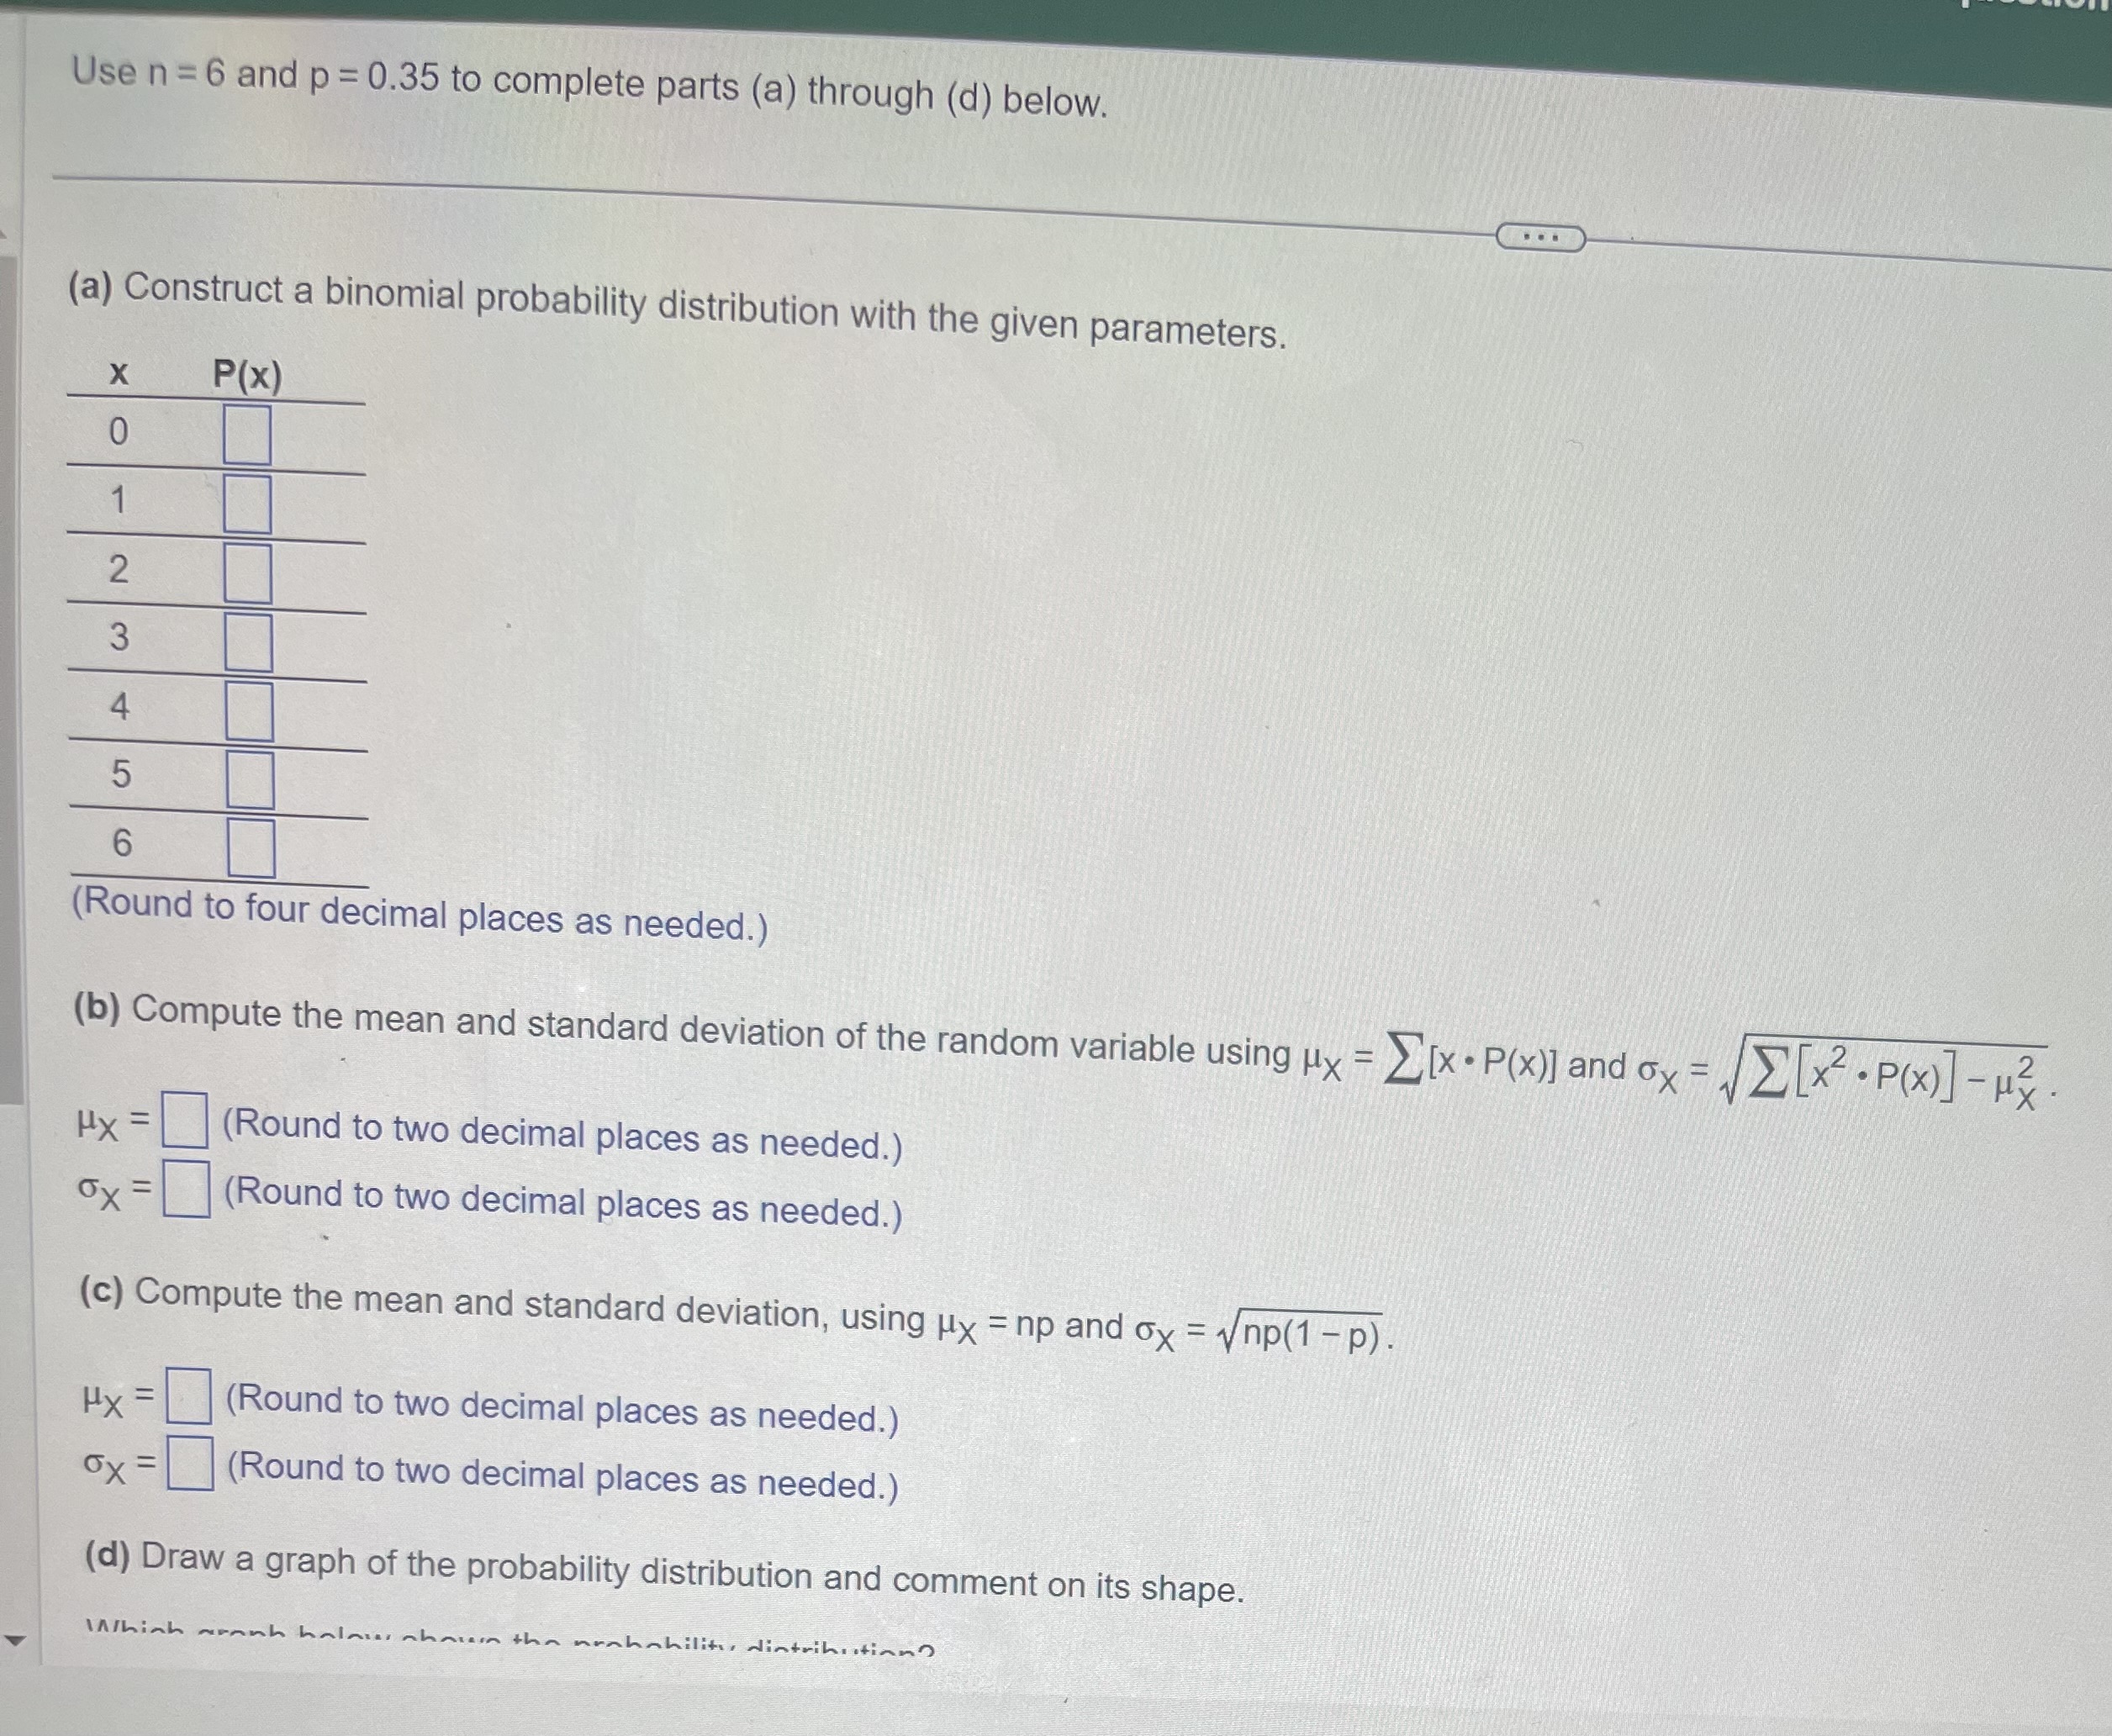
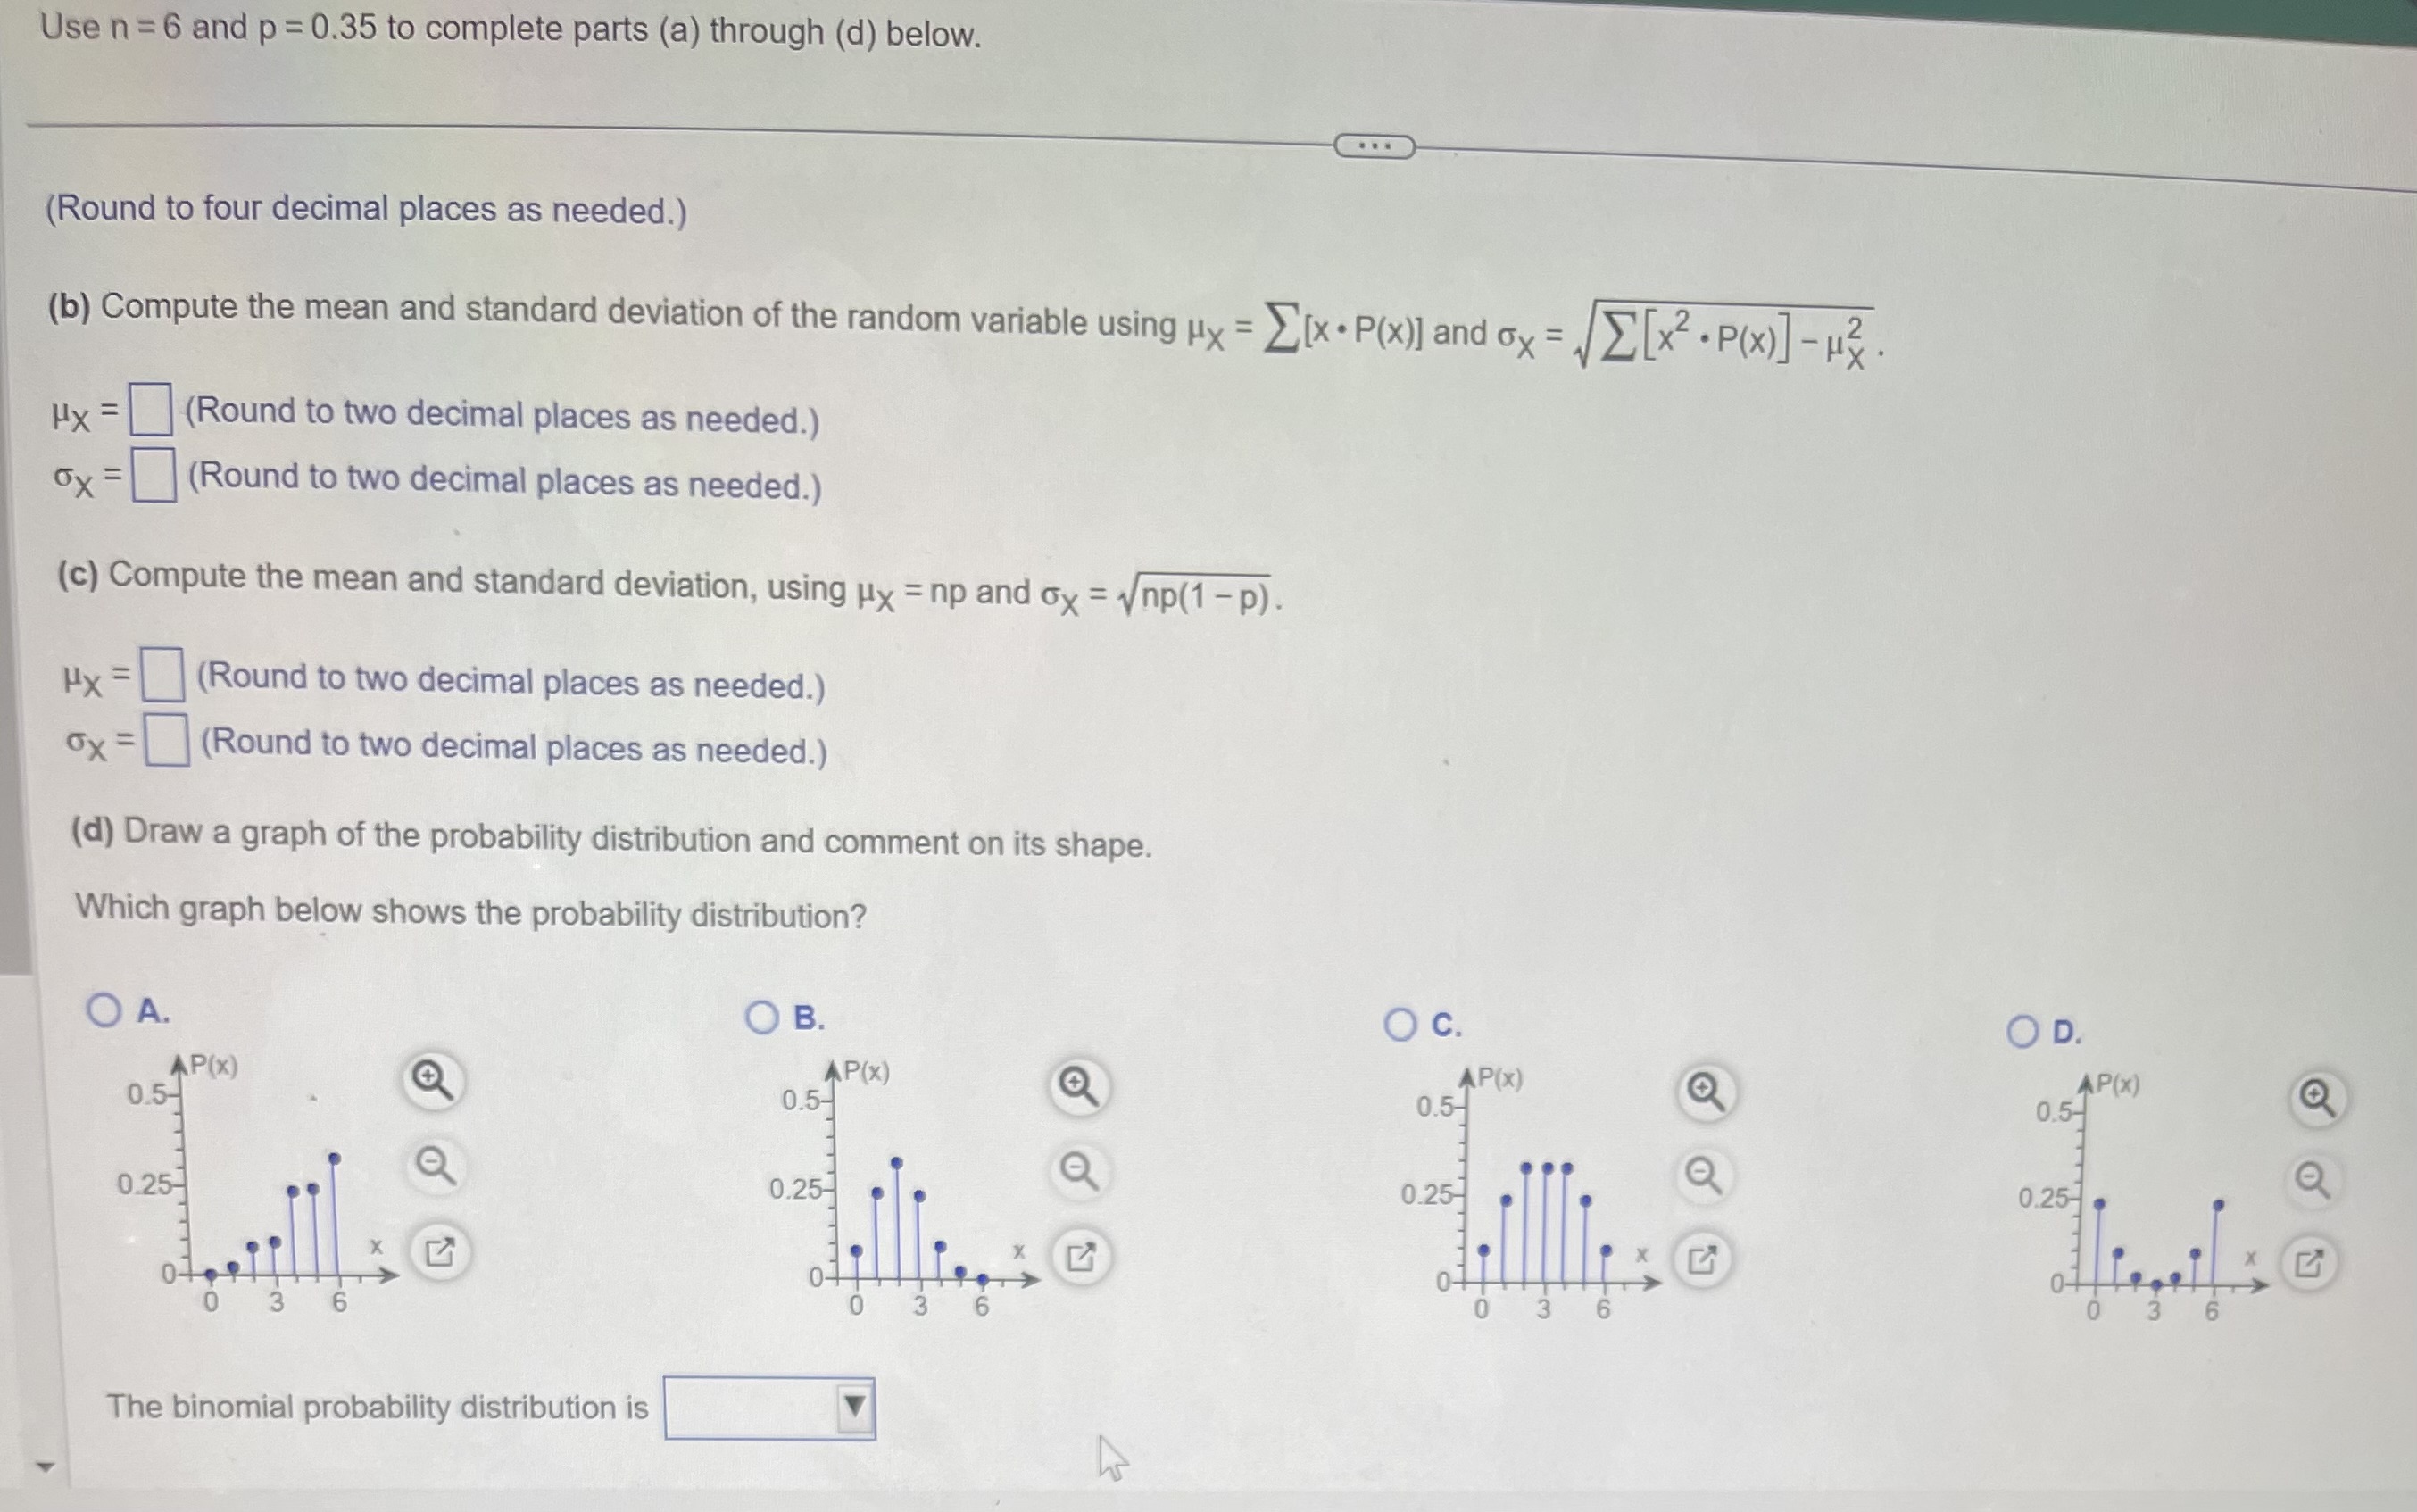
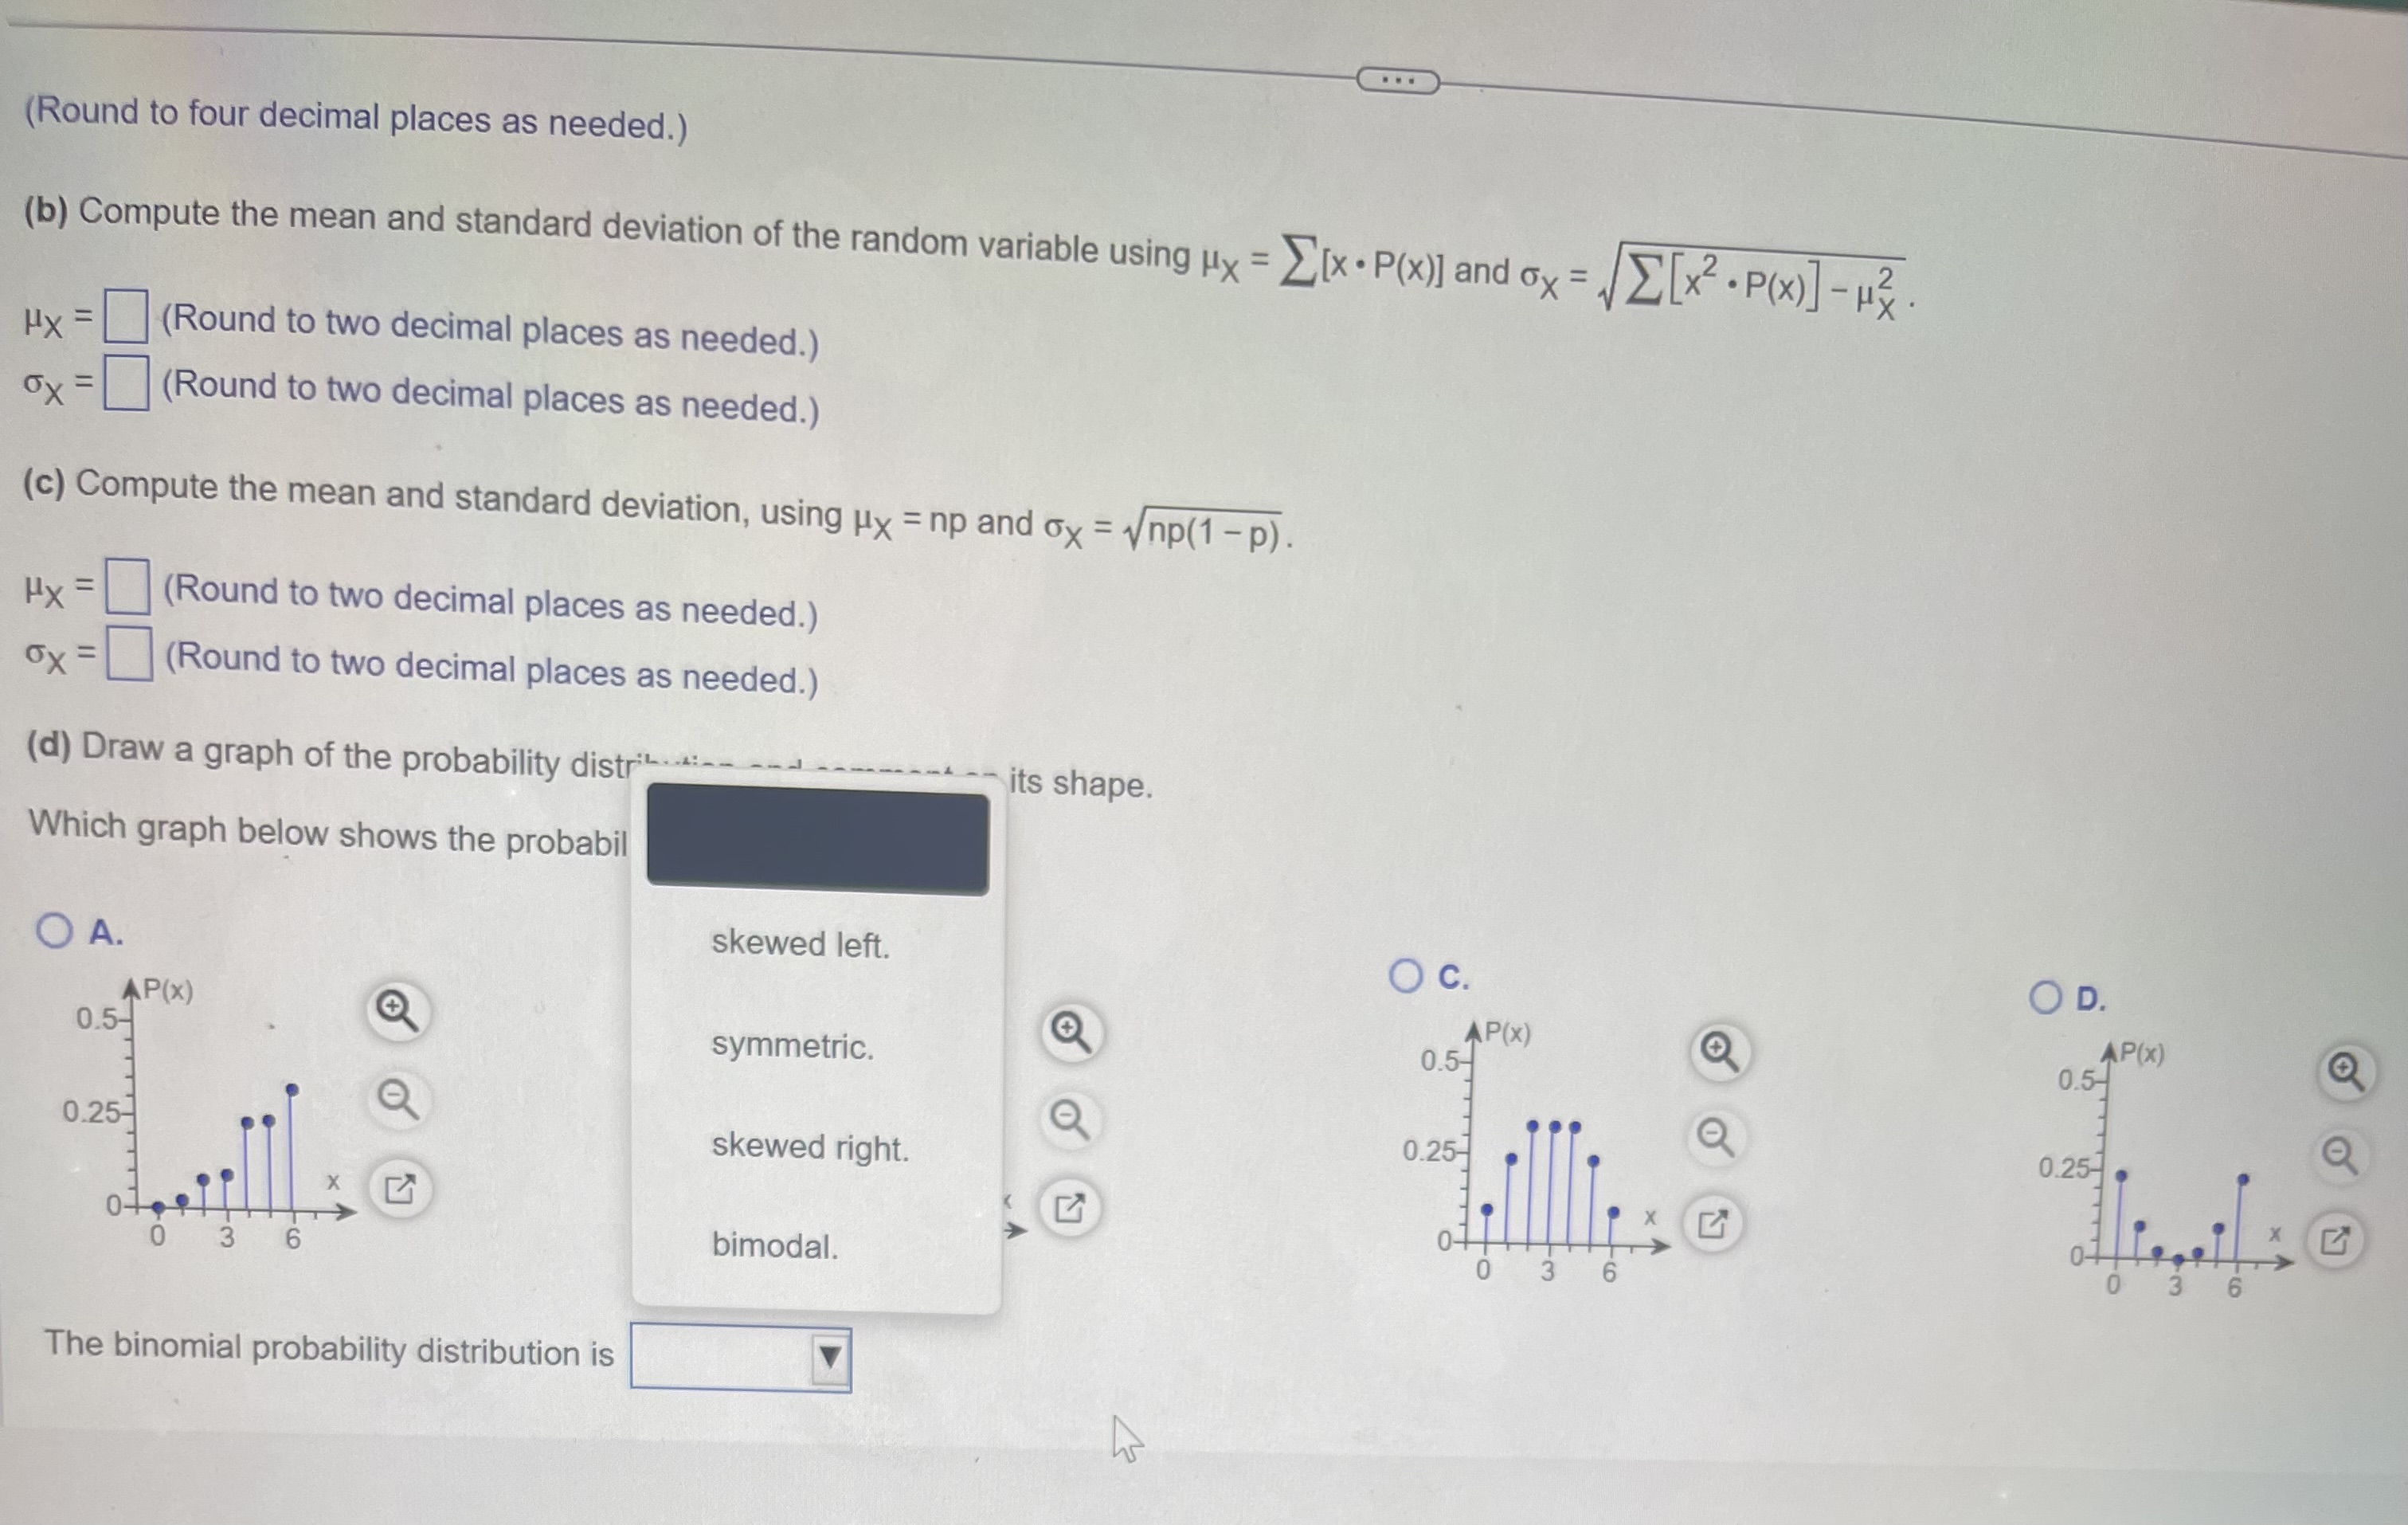
Use n = 6 and p = 0.35 to complete parts (a) through (d) below. (a) Construct a binomial probability distribution with the given parameters. X P(x) 0 2 UT 6 (Round to four decimal places as needed.) (b) Compute the mean and standard deviation of the random variable using ux = _ [x - P(x)] and ox = / _ [x2 - P(x)] -HX . HX =(Round to two decimal places as needed.) ox =(Round to two decimal places as needed.) (c) Compute the mean and standard deviation, using ux = np and ox = 1np(1 - p). HX =(Round to two decimal places as needed.) ox =(Round to two decimal places as needed.) (d) Draw a graph of the probability distribution and comment on its shape. hability, distribution ?Use n = 6 and p = 0.35 to complete parts (a) through (d) below. (Round to four decimal places as needed.) (b) Compute the mean and standard deviation of the random variable using My = _[x . P(x)] and ox = / E[x2 . P(x)] - HX . HX =(Round to two decimal places as needed.) ox = (Round to two decimal places as needed.) (c) Compute the mean and standard deviation, using Hy = np and ox = vnp(1 - p). Hx =(Round to two decimal places as needed.) ox =(Round to two decimal places as needed.) (d) Draw a graph of the probability distribution and comment on its shape. Which graph below shows the probability distribution? O A. O B. AP(X) O C. 0.5- AP(x) OD. 0.5- AP(x) 0.5- AP (X ) 0.25- 0.5- 0.25- 0.251 0.25- The binomial probability distribution is. . . (Round to four decimal places as needed.) (b) Compute the mean and standard deviation of the random variable using My = _[x . P(x)] and ox = / E[x2 . P(x)] -HX . HX =(Round to two decimal places as needed.) ox = (Round to two decimal places as needed.) (c) Compute the mean and standard deviation, using My = np and ox = Vnp(1 - p). HX = (Round to two decimal places as needed.) ox = (Round to two decimal places as needed.) (d) Draw a graph of the probability distri- - its shape. Which graph below shows the probabil O A. skewed left. O c. AP(X) OD. 0.5- symmetric. AP(x) 0.5- AP(x) 0.5- 0.25- skewed right. 0.25- 0.25- bimodal. O-L The binomial probability distribution is
Step by Step Solution
There are 3 Steps involved in it

Get step-by-step solutions from verified subject matter experts