

Question: Use Newtons interpolating polynomial to determine ln(x) at x = 2. Compute the finite divided differences as shown in the table presented in class. Show
Use Newtons interpolating polynomial to determine ln(x) at x = 2. Compute the finite divided differences as shown in the table presented in class. Show the coefficients for polynomials of first (f1(x)), second (f2(x)), and third (f3(x)) order. Plot the interpolating polynomials and the function ln(x) in the interval [0, 8]. The data points used in the interpolation are given by x 1 4 6 5 ln(x) 0.000000 1.386294 1.791759 1.609438 In the same plot, represent the data points (x1, ln x1), ...,(x4, ln x4) using markers (circles). Add a legend to your plot. A short report (2 pages max) showing calculations, the code used to create the plot and/or to calculate the polynomial coefficients, and the plot is due in class. USE MATLAB CODE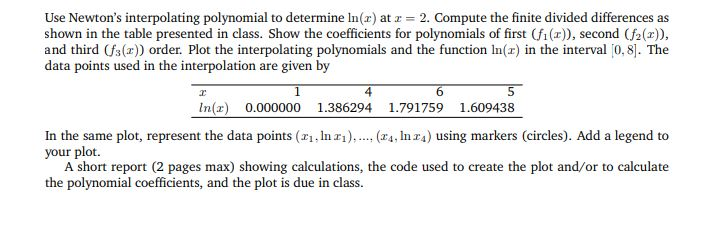
Use Newton's interpolating polynomial to determine In( at 2. Compute the finite divided differences as shown in the table presented in class. Show the coefficients for polynomials of first (fi(r), second (f2(x, and third (fs(x)) order. Plot the interpolating polynomials and the function In(x) in the interval 0, 8]. The data points used in the interpolation are given 5 In 0.000000 1.386294 1.791759 1.609438 4 6 In the same plot, represent the data points (i, Inri) your plot. (, In r4) using markers (circles). Add a legend to A short report (2 pages max) showing calculations, the code used to create the plot and/or to calculate the polynomial coefficients, and the plot is due in class Use Newton's interpolating polynomial to determine In( at 2. Compute the finite divided differences as shown in the table presented in class. Show the coefficients for polynomials of first (fi(r), second (f2(x, and third (fs(x)) order. Plot the interpolating polynomials and the function In(x) in the interval 0, 8]. The data points used in the interpolation are given 5 In 0.000000 1.386294 1.791759 1.609438 4 6 In the same plot, represent the data points (i, Inri) your plot. (, In r4) using markers (circles). Add a legend to A short report (2 pages max) showing calculations, the code used to create the plot and/or to calculate the polynomial coefficients, and the plot is due in class
Step by Step Solution
There are 3 Steps involved in it

Get step-by-step solutions from verified subject matter experts