

Question: Use numpy tools to create the plot, not python lists. Exercise Plot the functions y = x and y = x sin(x) over the
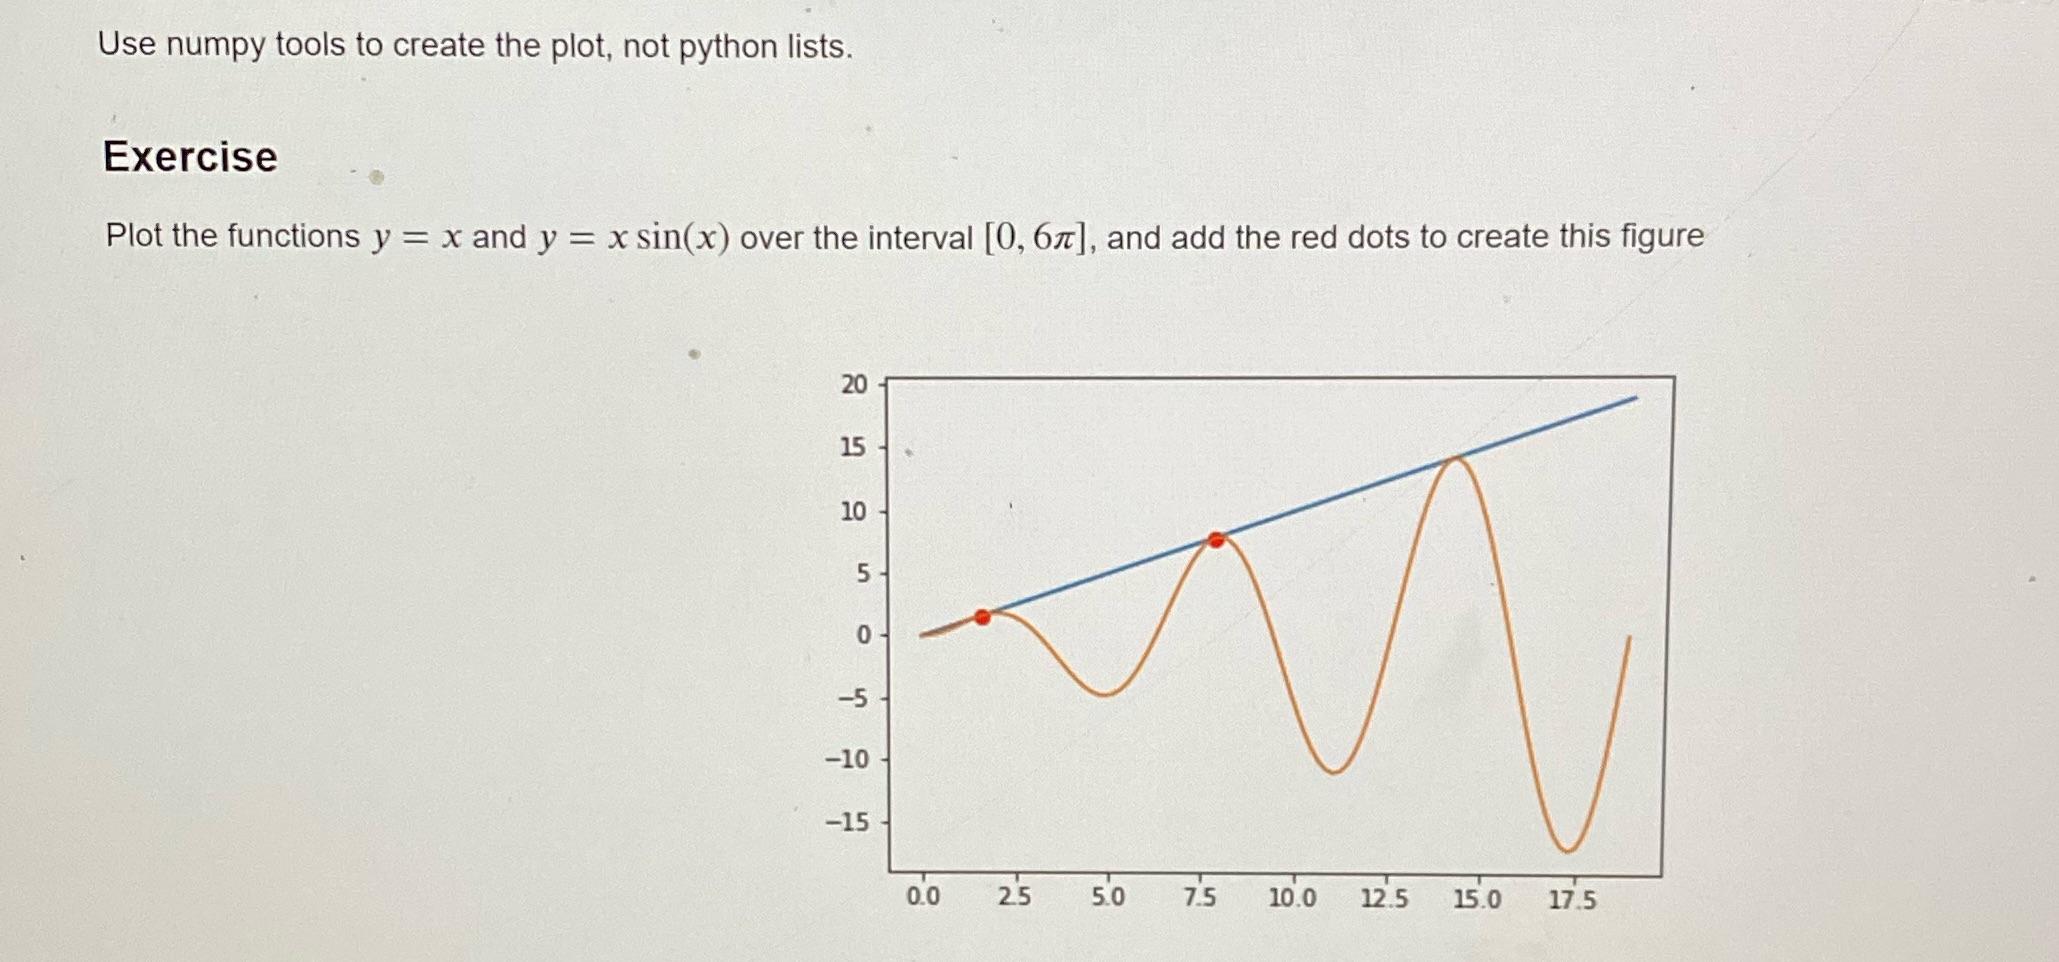
Use numpy tools to create the plot, not python lists. Exercise Plot the functions y = x and y = x sin(x) over the interval [0, 67], and add the red dots to create this figure 20 15 10 5 0 -5 -10 -15 0.0 2.5 5.0 7.5 10.0 12.5 15.0 17.5
Step by Step Solution
★★★★★
3.58 Rating (162 Votes )
There are 3 Steps involved in it
1 Expert Approved Answer
Step: 1 Unlock

Python program to create the given graph import matplotli... View full answer
Question Has Been Solved by an Expert!
Get step-by-step solutions from verified subject matter experts
Step: 2 Unlock
Step: 3 Unlock