

Question: Use picture 2, spreadsheet 5.1, as a template to do question 6 (first picture). please use excel and show work. 6. The stock of Business
Use picture 2, spreadsheet 5.1, as a template to do question 6 (first picture). please use excel and show work.
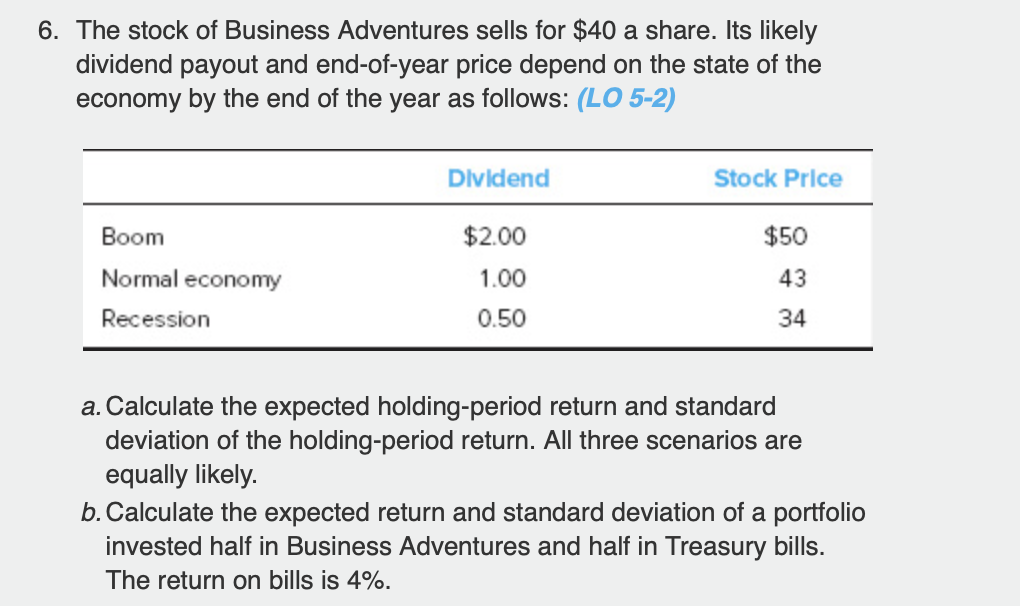
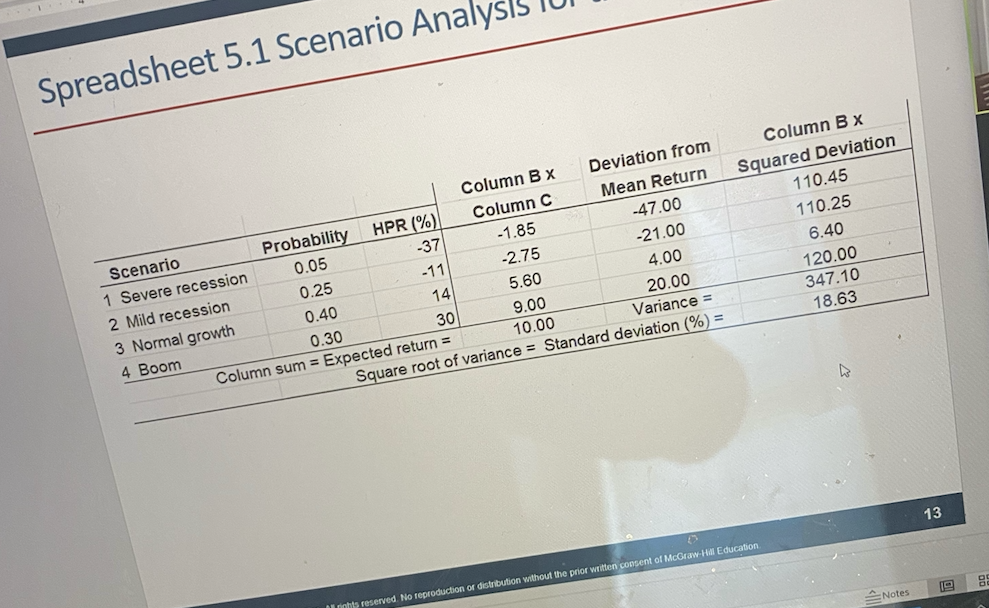
6. The stock of Business Adventures sells for $40 a share. Its likely dividend payout and end-of-year price depend on the state of the economy by the end of the year as follows: (LO 5-2) Dividend Stock Price Boom $2.00 $50 Normal economy 1.00 43 Recession 0.50 34 a. Calculate the expected holding-period return and standard deviation of the holding-period return. All three scenarios are equally likely. b. Calculate the expected return and standard deviation of a portfolio invested half in Business Adventures and half in Treasury bills. The return on bills is 4%. Spreadsheet 5.1 Scenario Analysis Column B x Squared Deviation 110.45 110.25 6.40 120.00 347.10 18.63 4.00 Column BX Deviation from Scenario Probability HPR (%) Column C Mean Return 1 Severe recession 0.05 -37 -1.85 -47.00 2 Mild recession 0.25 -11 -2.75 -21.00 3 Normal growth 0.40 14 5.60 4 Boom 0.30 30 9.00 20.00 Column sum = Expected return = 10.00 Variance = Square root of variance = Standard deviation (%) = 13 BE Notes hts reserved. No reproduction of distribution without the prior written consent of McGraw-Hill Education
Step by Step Solution
There are 3 Steps involved in it

Get step-by-step solutions from verified subject matter experts