

Question: USE PYTHON (Be sure to show all your code and results) (Cholesterol.csv) A study examining the health risks of smoking measured the cholesterol levels of
USE PYTHON (Be sure to show all your code and results)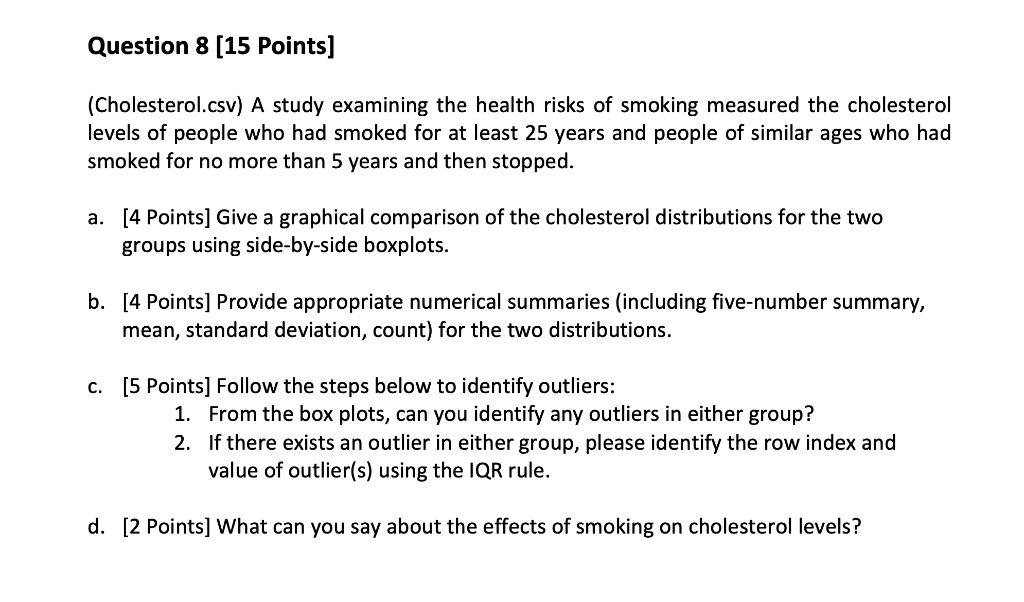
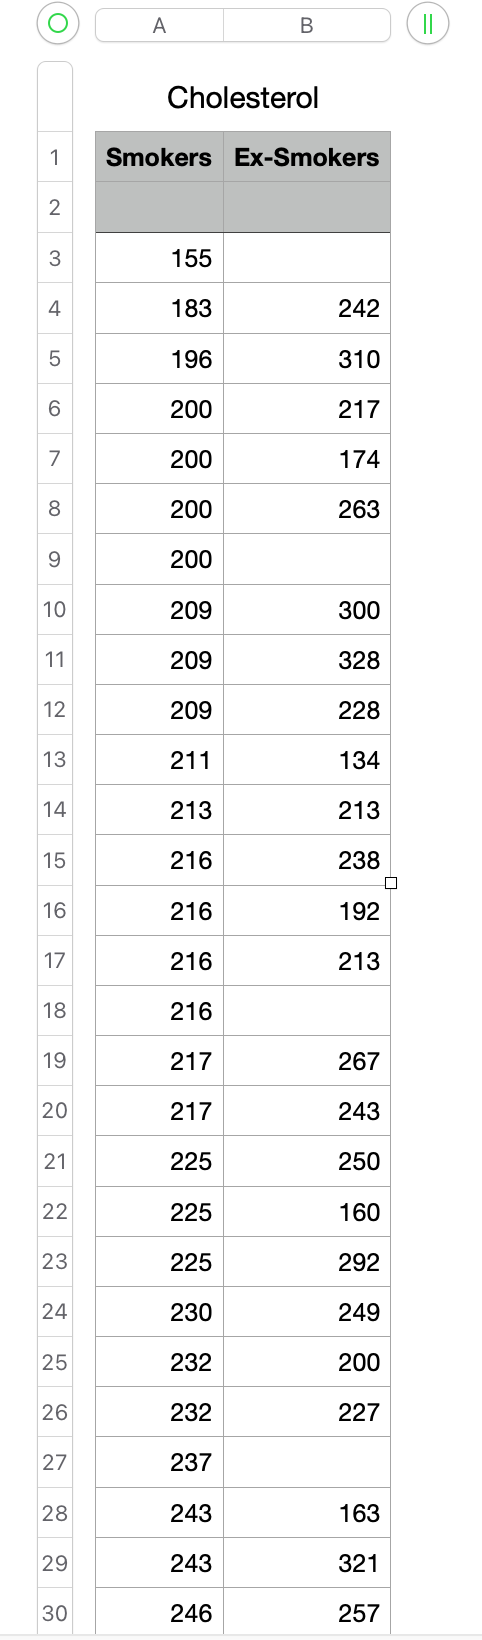
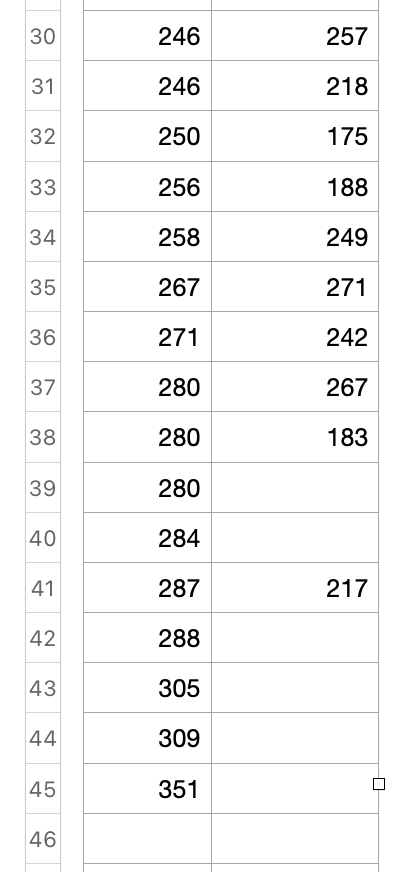
(Cholesterol.csv) A study examining the health risks of smoking measured the cholesterol levels of people who had smoked for at least 25 years and people of similar ages who had smoked for no more than 5 years and then stopped. a. [4 Points] Give a graphical comparison of the cholesterol distributions for the two groups using side-by-side boxplots. b. [4 Points] Provide appropriate numerical summaries (including five-number summary, mean, standard deviation, count) for the two distributions. c. [5 Points] Follow the steps below to identify outliers: 1. From the box plots, can you identify any outliers in either group? 2. If there exists an outlier in either group, please identify the row index and value of outlier(s) using the IQR rule. d. [2 Points] What can you say about the effects of smoking on cholesterol levels? Cholesterol \begin{tabular}{|l|r|r|} \hline 30 & 246 & 257 \\ \hline 31 & 246 & 218 \\ \hline 32 & 250 & 175 \\ \hline 33 & 256 & 188 \\ \hline 34 & 258 & 249 \\ \hline 35 & 267 & 271 \\ \hline 36 & 271 & 242 \\ \hline 37 & 280 & 267 \\ \hline 38 & 280 & 183 \\ \hline 39 & 280 & \\ \hline 40 & 284 & \\ \hline 41 & 287 & 217 \\ \hline 42 & 288 & \\ \hline 43 & 305 & \\ \hline 44 & 309 & \\ \hline 45 & 351 & \\ \hline 46 & & \\ \hline \end{tabular}
Step by Step Solution
There are 3 Steps involved in it

Get step-by-step solutions from verified subject matter experts