

Question: use python!!! intercept and slope, respectively, of the line from which we generate otir data. We'll generate a point (xi4yi) by choosing xi randomly, then
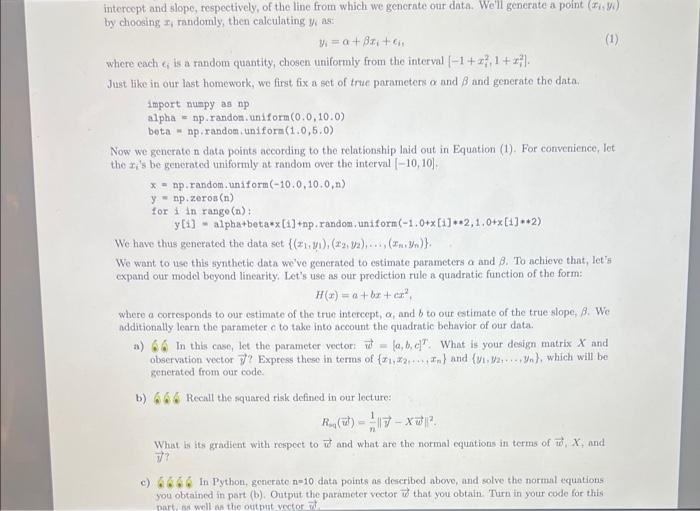
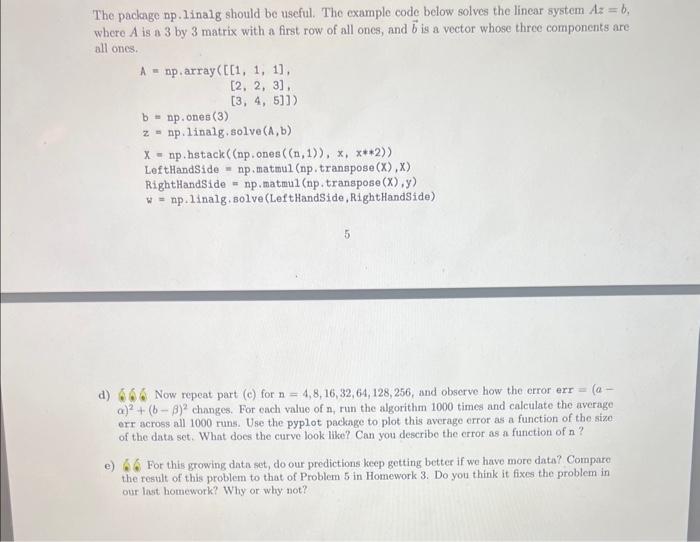
intercept and slope, respectively, of the line from which we generate otir data. We'll generate a point (xi4yi) by choosing xi randomly, then calculating y/ as: yi=+xi+cin where each i is a random quantity, chosen uniformly from the interval [1+xi2,1+xi2]. Jast like in our last homework, we first fix a set of true parameters and and generate the data. import numpy as np alpha = np.randon. uniform (0,0,10.0) beta = np,random, uniform (1,0,5.0) Now we generato n data points according to the relationship laid out in Equation (1). For convenience, Iet the xi 's be generated uniformly at random over the interval [10,10]. x=np,random,uniform(10,0,10,0,n)y=np,zerog(n)for1inrange(n)y[1]=alphatbeta*x[1]+np,randoa,uniform(1,0+x[1]2,1,0+x[1]2) We have thus generated the data set {(x1,y1),(x2,y2),,(xn,yn)}. We want to uee this synthetie data we've generated to estimate parameters and . To achieve that, let's expand our model beyond linearity. Let's use as our prediction rule a quadratic function of tho form: H(x)=a+bx+cx2, where a corresponds to our estimate of the true intercept, , and b to our estimate of the true slope, . We additionally learn the parameter c to take into account the quadratic behavior of our data. a) 6. In this case, let the parameter vector w=(a,b,c]X. What is your design matrix X and observation veetor y ? Express these in terms of {x1,x2,,xn} and {y1,y2,+yn}, which will be zenerated from our code. b) 6.66 Recall the squared risk defined in our lecture: Rsa(v)=n1vXw2. What is its gradient with respeet to w and what are the normal equations in terms of w,X, and y? c) G. is in Python, generate n=10 data points as deseribed above, and solve the normal equations. you obtained in part (b). Output the parameter vector w that you obtain. Turn in your code for this. nart iss woll an the outnut yector 0. The package np.linalg should be useful. The example code below solves the linear system Az=b, where A is a 3 by 3 matrix with a first row of all ones, and b is a vector whose three components are all ones. A=nparray([[1,1,1],[2,2,3],[3,4,5]])b=np.ones(3)z=np.linalg,solve(A,b)x=np,hstack((np,ones((n,1)),x,x2))LeftHandSide=np,matmu1(np,transpose(X),X)RightHandSide=np.matmul(nptranspose(X),y)w=np.1inalg,solve(LeftHandSide,RightHandSide) d) 66 Now repeat part (c) for n=4,8,16,32,64,128,256, and observe how the error err =(a )2+(b)2 changes. For each value of n, run the algorithm 1000 times and calculate the average orr across all 1000 runs. Use the pyplot package to plot this average error as a function of the sizeof the data set. What does the curve look like? Can you describe the error as a function of n ? e) A. For this growing datn set, do our predictions keep getting better if wo have more data? Compare the result of this problem to that of Problem 5 in Homework 3 . Do you think it fixes the problem in our last homework? Why or why not
Step by Step Solution
There are 3 Steps involved in it

Get step-by-step solutions from verified subject matter experts